Operations | Monitoring | ITSM | DevOps | Cloud

Latest Videos

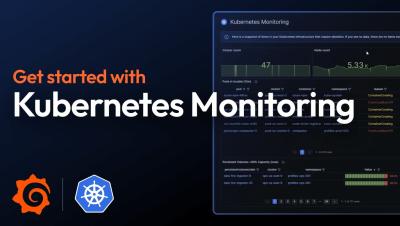
Kubernetes Monitoring: How to Get Started in Grafana Cloud | Grafana

Start monitoring your Kubernetes cluster in less than 3 minutes! This is a quick but comprehensive guide for getting started with Kubernetes Monitoring in Grafana Cloud. Ideal for both beginner and experienced users, you'll see a step-by-step approach for installing the Helm chart on your Kubernetes cluster so you can validate the health and integrity of your infrastructure. Helpful links: ☁️ Grafana Cloud is the easiest way to get started with metrics, logs, traces, dashboards, and more. We have a generous forever-free tier and plans for every use case.

How to Detect Infrastructure Anomalies with Kubernetes Monitoring in Grafana Cloud | Grafana

This video provides a comprehensive guide to initiating Kubernetes monitoring within Grafana Cloud, detailing a straightforward, step-by-step approach for installing the Helm chart on your cluster. It further ensures that you can validate the health and integrity of the data underpinning the solution, setting a solid foundation for effective monitoring practices. Ideal for both beginners and experienced users, this tutorial is designed to streamline your monitoring setup process with precision and ease.

How to start with Kubernetes monitoring in Grafana Cloud

This video provides a comprehensive guide to initiating Kubernetes monitoring within Grafana Cloud, detailing a straightforward, step-by-step approach for installing the Helm chart on your cluster. It further ensures that you can validate the health and integrity of the data underpinning the solution, setting a solid foundation for effective monitoring practices. Ideal for both beginners and experienced users, this tutorial is designed to streamline your monitoring setup process with precision and ease.

Introducing Grafana 10.3

Grafana 10.3 is here! From improving your ability to create and navigate complex canvas panels to monitoring via anonymous access control, this release is all about enhancing efficiency and clarity in your observability journey. In this video, learn more about: Canvas Pan and Zoom Improved Tooltips Metric Analysis Alerting enhancements Multi-stack data sources Anonymous access control Stay with us through this playlist to delve deeper into each addition and maximize your Grafana 10.3 experience.

Exploring logs, metrics, and traces with Grafana - Grafana for Beginners Ep. 7

Exploring logs, metrics and traces for the first time could be an overwhelming experience if you don't know where to start. Join Senior Developer Advocate, Lisa Jung to get the 101 on using the Grafana explore tool and start exploring your data! Best practices.