Operations | Monitoring | ITSM | DevOps | Cloud

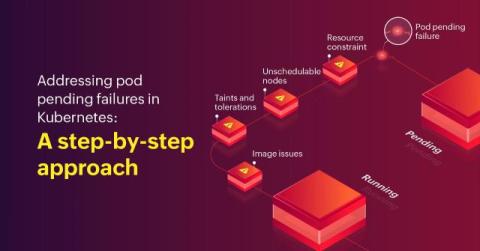
Debugging Kubernetes pod pending failures

Every pod has its purpose. During an application deployment, all the workloads in the cluster work cohesively and ensure that the deployment launches—without any hiccups. When a pod is created, it starts its lifetime in a Pending state. A pod is in the Pending state when it is still in the process of being scheduled for deployment. When it is scheduled for deployment and the containers have started, it converts to the Running phase. It only takes a few seconds for the phase transition.

Master debugging with four ways to visualize your traces

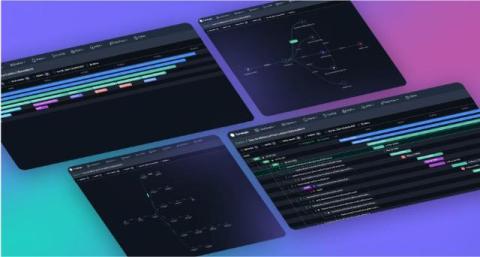
In a world where microservices rule and distributed architectures are the norm, understanding how a single request flows through your system can be an overwhelming challenge. But don’t worry—there’s light at the end of the tunnel! And not just one light, but four.

Embedded World North America 2024 Recap

Last week, a handful of Memfolks had the opportunity to travel to Austin to attend the first ever Embedded World North America1! Embedded World NA welcomed 3,500 visitors and 180 vendors across 3 days2. While it was surely a smaller showing than Nueremburg’s Embedded World, we still wanted to quickly touch on our takeaways from the event. In this post, we will cover what we learned from the first Embedded World North America.

How Generative AI Is Revolutionizing Debugging

In the rapidly evolving landscape of software development, the integration of generative AI has become a game-changer for organizations striving to deliver high-quality software at scale. Among its many transformative applications, autonomous debugging stands out as a critical advancement, offering the potential to revolutionize the way development teams tackle errors and maintain operational efficiency.

Comparing Firmware Development Environments - Linux, Windows, WSL2, and VMWare

About a year and a half ago, I decided to take a different approach to setting up a Zephyr environment for a new project at Intercreate. Instead of using my trusty VMWare Workstation Linux VM, I opted for WSL2. I was curious to find out: Would hardware pass-through for debugging work reliably? Would all of the tooling dependencies be supported? What about build system performance?

Launch Week Keynote: Log Management and Analytics

Logs have always been a critical component of observability, extending beyond embedded development. Many embedded teams rely heavily on logs and strive to enhance efficiency. Some struggle to extract value from their logs due to the complexities of collection and analysis. Regardless of your team's current situation, we are here to help. Our new Log Management and Analytics offering streamlines log collection, accelerates investigations, and transforms your logs into easily accessible insights across your entire fleet.

Debugging a Slack Integration with Sentry's Trace View

While building Sentry, we also use Sentry to identify bugs, performance slowdowns, and issues that worsen our users’ experience. With our focus on keeping developers in their flow as much as possible, that often means identifying, fixing, and improving our integrations with other critical developer tools. Recently, one of our customers reported an issue with our Slack integration that I was able to debug and resolve with the help of our Trace View.

Observability and Tracing: How to Improve Your Debugging Workflow

Having the right tools to support debugging is crucial for improving application performance and delivering an enhanced user experience. Traditional observability tools provide insights into application health and with a shift towards actionability, they also directly aid in the debuggability of your system, helping you pinpoint the root cause of issues in real-time.