Operations | Monitoring | ITSM | DevOps | Cloud

ObservIQ

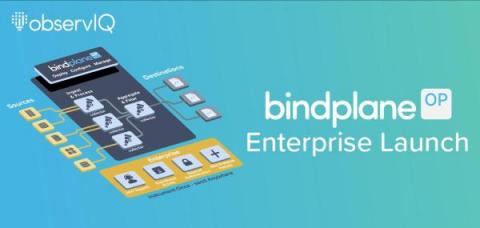
observIQ Announces Enterprise Edition of Open Source Observability Pipeline BindPlane OP

Continuing its commitment to open source observability, observIQ announces the enterprise edition of BindPlane OP. BindPlane OP provides the ability to control observability costs and simplify the management of telemetry agents at scale while avoiding vendor lock-in.

Ship AWS Cloudwatch Logs to Any Destination with OpenTelemetry

With observIQ’s latest contributions to OpenTelemetry, you can now use free open source tools to easily aggregate logs across your entire infrastructure to any or multiple analysis tools. The easiest way to use the latest OpenTelemetry tools is with observIQ’s distribution of the OpenTelemetry collector. You can find it here.

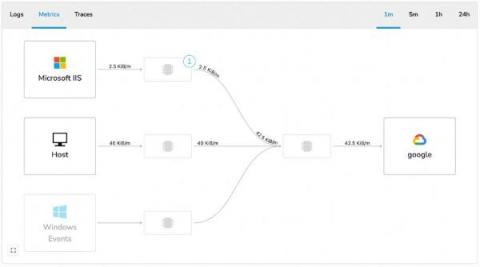
How to Enrich Logs and Metrics with OpenTelemetry Using BindPlane OP

Data enrichment is the process of adding additional context or attributes to telemetry data at the source that increases its value during analysis. OpenTelemetry, a collaborative open source telemetry project with the largest organizations in the observability space, can be configured to enrich logs and metrics from dozens of sources. This blog will show you the basics of how to use BindPlane OP to easily deploy and configure OpenTelemetry to enrich data from a source.

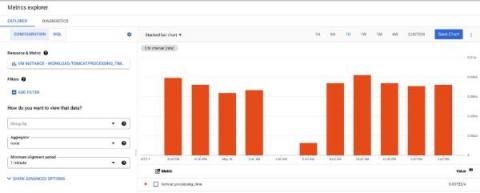
How to monitor Oracle DB with Google Cloud Platform

Monitor Oracle DB in Google Cloud Platform with the Google Ops Agent. The Ops Agent is available on GitHub, and makes it easy to collect and ship telemetry from dozens of sources directly to your Google Cloud Platform. You can check it out here! Below are steps to get up and running quickly with observIQ’s Google Cloud Platform integrations, and monitor metrics and logs from Oracle DB in your Google Cloud Platform.

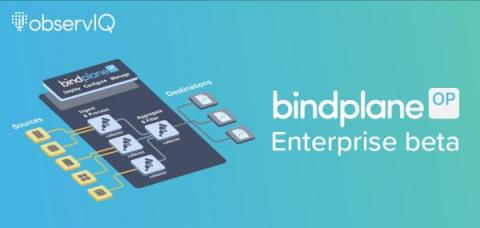
BindPlane OP Enterprise Beta Announcement

Since introducing BindPlane OP earlier this year, we’ve received a lot of feedback asking for the enterprise features you require to deploy in production. With functionality like SSO, RBAC, and Audit reporting all surfacing to the top of that list. Today we’re launching BindPlane OP Enterprise in beta, which introduces support for LDAP and AD authentication. We’d love for you to try it out and let us know what you think.

How to Reduce Data Costs with OpenTelemetry and BindPlane OP

Data costs fill a large column in many organizations’ accounting sheets. Data pipeline setup and management is a large time sink for DevOps, IT, and SRE. Setting up telemetry pipelines to reduce unwanted data often takes even more time that could better be spent creating value rather than reducing costs. This blog will show you one way to quickly set up your data pipeline to filter unnecessary telemetry data.

How to Monitor Aerospike with OpenTelemetry

With observIQ’s latest contributions to OpenTelemetry, you can now use free open source tools to easily monitor Aerospike. The easiest way to use the latest OpenTelemetry tools is with observIQ’s distribution of the OpenTelemetry collector. You can find it here. In this blog, the Aerospike receiver is configured to monitor metrics locally with OTLP–you can use the Aerospike receiver to ship metrics to many popular analysis tools, including Google Cloud, New Relic, and more.

How to monitor Vault with Google Cloud Platform

Monitor Vault in Google Cloud Platform with the Google Ops Agent. The Ops Agent is available on GitHub, and makes it easy to collect and ship telemetry from dozens of sources directly to your Google Cloud Platform. You can check it out here! Below are steps to get up and running quickly with observIQ’s Google Cloud Platform integrations, and monitor metrics and logs from Vault in your Google Cloud Platform.

How to monitor Couchbase with Google Cloud Ops

You can now easily monitor couchbase metrics and logs in Google Cloud. All of our logging and monitoring Google Cloud contributions are available through the Google Ops Agent GitHub repository. You can check it out here! The Google Ops Agent uses the built-in Prometheus exporter and receiver to monitor Couchbase sources running Couchbase 7.0. You can find documentation on the Prometheus exporter in the Couchbase documentation.