The DevOps pipeline is a crucial part of software development, but it can often get mired in bottlenecks. Most problems are caused by the development and operations teams having different responsibilities are due to inefficiencies in the pipeline design. However, thanks to continuous observability, DevOps now gets a new lease of life since it is possible to tweak the pipeline to suit the developer’s workflow.
As a developer, how much time do you actually spend writing code? According to this survey by The New Stack, developers spend less than one-third (32%) of their time writing new or improving existing code. And this is because they get stuck in multiple tasks that aren’t really part of their main responsibilities.
DevOps isn’t a sprint, it’s a marathon without a finish line in sight. Developers and IT teams join forces throughout the product life cycle, even in production, to achieve and maintain high-quality software that users love. It’s simple, and it works. In fact, according to Statista, DevOps/DevSecOps is the most practiced software development methodology globally, used by 35.9% of software development teams.
Debugging is an unavoidable part of software development, especially in production. You can often find yourself in “debugging hell,” where an enormous amount of debugging consumes all your time and keeps the project from progressing. According to a report by the University of Cambridge, programmers spend almost 50% of their time debugging. So how can we make production debugging more effective and less time-consuming?
Kubernetes is one of the most well-known open-source systems for automating and scaling containerized applications. Usually, you declare the state of the desired environment, and the system will work to keep that state stable. To make changes “on the fly,” you must engage with the Kubernetes API.
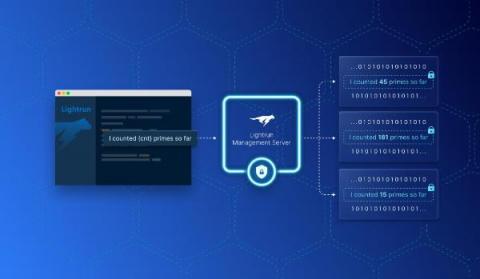
HTTP is the backbone of all API-centric, modern web apps. APIs are the place where the core business logic of an application lives. As a result, developers spend a lot of time optimizing the API business logic. This article addresses a Node.js developer’s dilemma while debugging an HTTP API request. We take a sample Node.js/Express.js-based HTTP service to demonstrate a new way of debugging Node.js applications using the Lightrun observability platform.
A logging framework is a software tool that helps developers output diagnostic information during the execution of a program. This information is used to debug the program or monitor its performance. There are many different logging frameworks available, starting with simple logging libraries to full-fledged logging and observability platforms.
Logs are key to monitoring the performance of your applications. Kubernetes offers a command line tool for interacting with the control plane of a Kubernetes cluster called Kubectl. This tool allows debugging, monitoring, and, most importantly, logging capabilities. There are many great tools for SREs. However, Kubernetes supports Site Reliability Engineering principles through its capacity to standardize the definition, architecture, and orchestration of containerized applications.