The COVID-19 pandemic has forced many companies to require employees to work from home. It’s a new normal for many, but at Grafana Labs our team has always recruited and operated with a remote-first culture in mind. To help everyone transition to a home office environment, we launched a new WFH series in which Grafana team members have been sharing their best advice for staying productive at home – yes, even if you have kids around.
Grafana v7.0 is coming next month! Here’s a sneak peek of one new feature: the auto grid layout. This new 7.0 feature is for the gauge and stat panels. Before, stat and gauge only supported horizontal or vertical stacking: The auto layout mode just selected vertical or horizontal stacking based on the panel dimensions (whatever was highest).
If you want to skip ahead to see the MITRE ATT&CK eval round 2 results visualized in an easy-to-configure Kibana dashboard, check it out here.
Did you know that Grafana pairs well with a fine wine? That’s what machine learning company ML6 discovered when they worked with their client Accolade Wines, an award-winning Australian vintner whose goal was to decrease the waste produced in its global operations. “Accolade Wines is really focused on being as efficient as possible,” says Rebecca Brooke, ML6’s team leader in the U.K. “They’re always looking at minimizing their environmental impact.”
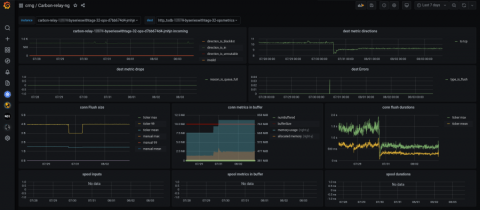
One of the most common dashboards for metric visualization and alerting is, of course, Grafana. In addition to logs, we use metrics to ensure the stability and operational observability of our product. This document will describe some basic Grafana operations you can perform with the Coralogix-Grafana integration. We will use a generic Coralogix Grafana dashboard that has statistics and information based on logs. It was built to be portable across accounts.
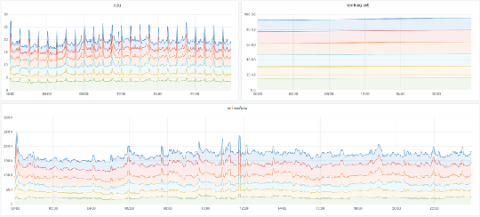
When working with observability data, a good portion of it comes in as time series data — things like CPU or memory utilization, network transfer, even application trace data. And the Elastic Stack offers powerful tools within Kibana for time series analysis, including TSVB (formerly Time Series Visual Builder). In this blog post, I’m going to attempt to demystify rates in TSVB by walking through three different types: positive rates, rate of change, and event rates.