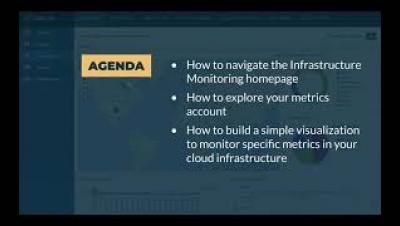
Yesterday, my colleague Mike Elsmore wrote a blog about sending metrics to Logz.io Infrastructure monitoring – now let’s analyze them by building Grafana visualizations! Once you’ve started to send metric data to Logz.io, how do you visualize and interpret that data so that it’s useful for you? In Logz.io Infrastructure Monitoring, we use Grafana to provide dashboards and bring meaningful information to light.
Histograms are one of my favorite topics in the Prometheus universe. Last November, I delivered a talk at PromCon EU 2019 that was titled Prometheus Histograms – Past, Present, and Future. Only the part about the past had to be cut due to time constraints. But I made a promise to resurrect my talk about the history of histograms and I kept my word. In February, I premiered the Secret History of Prometheus Histograms at FOSDEM 2020.
Hello again! We are Eldin and Christine – or, as our lovely editor has dubbed us, Regis and Kelly – jumping back in for another post. This week, to highlight the big tent and community theme, we are going to write about how our Datadog plugin allows you to “see it all in one place.” Datadog is a popular monitoring and analytics platform that allows you to easily install an agent so you can get started with collecting metrics right away.
In the midst of a complex and challenging global environment, I’m proud and excited to announce General Availability for Logz.io Infrastructure Monitoring, our new metrics monitoring and analytics solution based on Grafana. Additionally, we’re supporting Early Availability for our new Distributed Tracing offering powered by Jaeger. The release represents a huge next step in our mission to provide the best open source for observability as a fully managed, cost-effective cloud service.
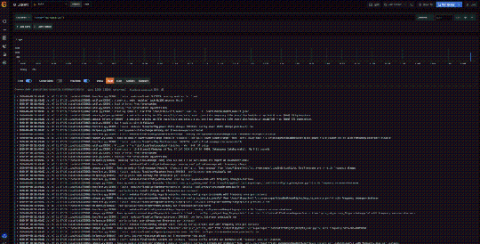
Greetings! This is Eldin and Ronald reporting in from the Solutions Engineering team at Grafana Labs. You’ve probably seen some previous posts from our colleagues Christine and Aengus or maybe some of the fantastic Loki videos that Ward has put up on YouTube. This week, Ronald and I will walk through how to leverage Prometheus and Loki as data sources to create a simple but awesome Grafana dashboard that enables quick searches of logs.
This blog post will pit Grafana vs Graphite against each other, two of the most popular observability tools on the market today. R&D organizations typically implement a wide technology stack. They include varying services, systems, or tools to support their production and development environments. Most, if not all, of these companies have SLAs requiring R&D to provide high availability solutions and the ability to respond to incidents in real time.
In this article, learn: Given that enterprises use a mix of physical, virtual, and cloud native infrastructure, it can be a struggle to maintain the availability and performance of digital services. OpsRamp's Topology Explorer delivers visual representations of dependency relationships between application components and hybrid infrastructure that feed into both service maps and service-centric AIOps.