Operations | Monitoring | ITSM | DevOps | Cloud

Datadog

Datadog's AWS re:Invent 2018 guide

Each November, AWS re:Invent draws thousands of AWS staff, partners, and users to Las Vegas for an intense week featuring all things AWS and AWS-related. As always, Datadog will be there and we’d love to meet you in person. Our engineers are excited to show off the new features they’ve been building and to answer your monitoring questions!

Monitoring Apache Spark applications running on Amazon EMR

We recently implemented a Spark streaming application, which consumes data from from multiple Kafka topics. The data consumed from Kafka comprises different types of telemetry events generated by mobile devices. We decided to host the Spark cluster using the Amazon EMR service, which manages a fleet of EC2 instances to run our data-processing pipelines.

8 Emerging Trends in Container Orchestration

As Docker adoption continues to rise, many organizations have turned to orchestration platforms like ECS and Kubernetes to manage large numbers of ephemeral containers. Thousands of companies use Datadog to monitor millions of containers, which enables us to identify trends in real-world orchestration usage. We're excited to share 8 key findings of our research.

Monitoring Modern Infrastructure

The elasticity and nearly infinite scalability of the cloud have transformed IT infrastructure. Modern infrastructure is now made up of constantly changing, often short-lived VMs or containers. This has elevated the need for new methods and new tools for monitoring. In this eBook, we outline an effective framework for monitoring modern infrastructure and applications, however large or dynamic they may be.

Introducing the Datadog Cluster Agent

As containers and orchestrators have surged in popularity, they have created highly dynamic environments with rapidly changing workloads—and the need for equally dynamic ways of monitoring them. After all, orchestration technologies like Kubernetes, DC/OS, and Swarm manage container workloads both at the node level and at the cluster level, which means that you need to gather insights from every layer to fully understand the state of your infrastructure.

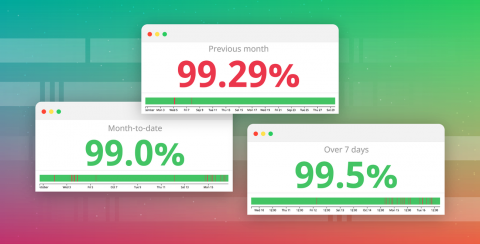
Track the status of your SLOs with the new monitor uptime widget

Service level objectives are an important tool for maintaining application performance, ensuring a consistent customer experience, and setting expectations about service performance for both internal and external users. We are very pleased to announce the availability of a new monitor uptime widget that makes it simple to monitor the status of your SLOs and communicate that status to your teams, executives, or external customers.

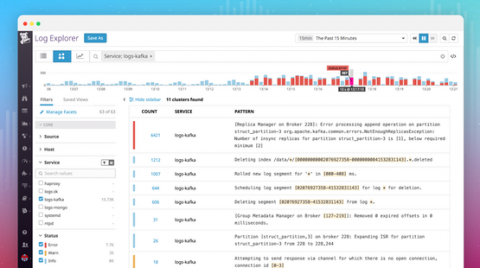
Log Patterns: Automatically cluster your logs for faster investigation

Sifting through all your logs to find what you need can be challenging—especially during an outage, when time is critical and you’re flooded with WARN and ERROR messages. To help you immediately surface useful information from large volumes of logs, we developed Log Patterns.

Pivotal Cloud Foundry Monitoring with Datadog

In part three of this series, we showed you a number of methods and tools for accessing key metrics and logs from a Pivotal Cloud Foundry deployment. Some of these tools help PCF operators monitor the health and performance of the cluster, whereas others allow developers to view metrics, logs, and performance data from their applications running on the cluster.