Operations | Monitoring | ITSM | DevOps | Cloud

Datadog

Signal Sciences brings real-time web attack visibility to Datadog

Signal Sciences is proud to announce our integration with the Datadog platform. This integration furthers our mission of producing the leading application security offering that empowers operations and development teams to proactively see and respond to web attacks—wherever and however they deploy their apps, APIs, and microservices.

Automate workflows with Datadog's Amazon EventBridge integration

Amazon EventBridge is a serverless event bus that routes real-time data streams from your applications and services to targets like AWS Lambda. EventBridge facilitates event-driven application development by simplifying the process of ingesting and delivering events across your application architecture, and by providing built-in security and error handling. We are excited to announce that you can now use our new integration to route Datadog alerts to EventBridge with minimal configuration or setup.

Cross-tenant monitoring with Azure Lighthouse and Datadog

Azure Lighthouse is a new feature that provides improved access management for users and applications across different Azure tenants. With Azure Lighthouse, managed service providers (MSPs) can manage their customers’ environments more easily and efficiently than ever before. Datadog is proud to announce support for Azure Lighthouse, which ensures that MSPs can implement a streamlined, scalable approach to monitoring their customers’ Azure environments.

How to use ApacheBench for web server performance testing

When developing web services and tuning the infrastructure that runs them, you’ll want to make sure that they handle requests quickly enough, and at a high enough volume, to meet your requirements. ApacheBench (ab) is a benchmarking tool that measures the performance of a web server by inundating it with HTTP requests and recording metrics for latency and success.

Consul monitoring tools

In Part 1, we looked at metrics and logs that can give you visibility into the health and performance of your Consul cluster. In this post, we’ll show you how to access this data—and other information that can help you troubleshoot your Consul cluster—in four ways: Consul provides a built-in CLI and API that you can use to query the most recent information about your cluster, giving you a high-level read into Consul’s health and performance.

Kubernetes Control Plane monitoring with Datadog

In a Kubernetes cluster, the machines are divided into two main groups: worker nodes and master nodes. Worker nodes run your pods and the applications within them, whereas the master node runs the Kubernetes Control Plane, which is responsible for the management of the worker nodes. The Control Plane makes scheduling decisions, monitors the cluster, and implements changes to get the cluster to a desired state.

Lessons learned from running Kafka at Datadog

At Datadog, we operate 40+ Kafka and ZooKeeper clusters that process trillions of datapoints across multiple infrastructure platforms, data centers, and regions every day. Over the course of operating and scaling these clusters to support increasingly diverse and demanding workloads, we’ve learned a lot about Kafka—and what happens when its default behavior doesn’t align with expectations.

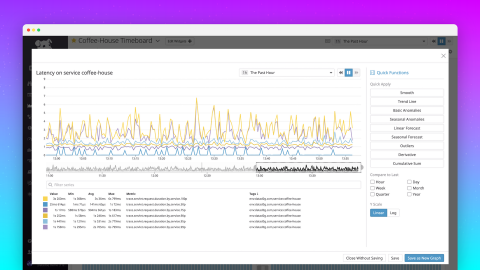
Explore your data in full-screen graph mode

As you navigate through Datadog, you may find that you want to dive into a graph to explore your timeseries data more deeply, or make quick changes to a graph without permanently altering it. To make it easier to explore the data in your graphs, we’re excited to introduce a newly revamped full-screen view for our timeseries graphs. You can now quickly and easily apply functions, navigate through time to find anomalies, and save and share your work.