Operations | Monitoring | ITSM | DevOps | Cloud

Splunk

A Primer for Monitor as Code: How to use Splunk Observability Cloud with Terraform

Managing the complexities of today’s cloud native infrastructure has resulted in the increased need for observability. As cloud adoption continues to grow, the need to deliver a better customer experience, scale efficiently and increase momentum on innovation has never been more important. For many organizations to carry out these principles, two technologies are helping organizations deliver on these goals faster: Monitoring-as-Code and Infrastructure-as-Code.

Splunk Embarks on AWS Graviton Journey with Amazon EC2 Im4gn and Is4gen Instances

We are excited to announce that Splunk Cloud Platform is moving to next generation AWS Graviton2 processor hardware to help enable enhanced performance for customers who choose AWS as a provider. This begins a phased transition of our Splunk Cloud Platform indexer tier in a move that will help Splunk operate more efficiently and provide customers with the cutting edge in processing technology.

Getting Started with Machine Learning at Splunk

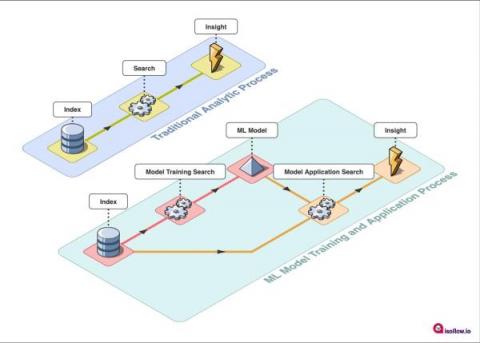
I’m sure many of you have heard of our Machine Learning Toolkit (MLTK) app and may even have played around with it. Some of you might actually have production workloads that rely on MLTK without being aware of it, such as predictive analytics in Splunk IT Service Intelligence (ITSI) or MLTK searches in Splunk Enterprise Security.

Is the Cloud an Experience or a Destination?

In a recent episode of the Cloud Happens podcast, Archana Venkatraman, Associate Research Director in Cloud Data Management at IDC Europe talks about how the cloud isn’t a destination. It’s a continuum; a journey. In this blog, we explore that idea a bit more and dive into what really encapsulates a cloud experience. How can modern enterprises benefit from their cloud journey to solve the most gnarly data challenges to unlock innovation, enhance security, and drive resilience.

API & HTTP Headers: How to Use Request Headers in API Checks

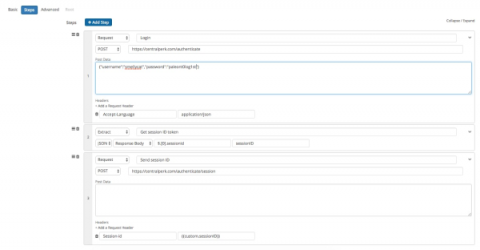
In previous posts we covered why it’s important to monitor APIs and how to monitor and validate data from APIs. In this post we’ll focus on a simple but key feature that helps Splunk Synthetic Monitoring users create robust checks for availability, response time, and multi-step processes: Request Headers

Quickly identify client side errors and latency, with Splunk RUM

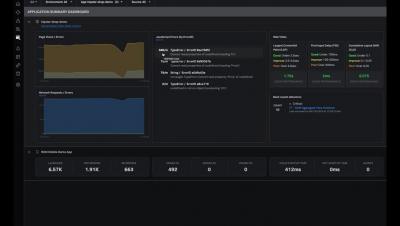
Splunk RUM (Real User Monitoring) helps software engineers quickly identify and isolate the most glaring client side performance issues, from errors to latency. Easily measure performance across your entire production environment, to specific services or applications, and seamlessly click into backend service performance.

SRE Metrics: Four Golden Signals of Monitoring

SRE (site reliability engineering) is a discipline used by software engineering and IT teams to proactively build and maintain more reliable services. SRE is a functional way to apply software development solutions to IT operations problems. From IT monitoring to software delivery to incident response – site reliability engineers are focused on building and monitoring anything in production that improves service resiliency without harming development speed.