How to monitor and troubleshoot BIND 9
Find out how to effectively and easily monitor and troubleshoot BIND 9 using Netdata.


Find out how to effectively and easily monitor and troubleshoot BIND 9 using Netdata.
Find out how to effectively and easily monitor and troubleshoot Memcached using Netdata.
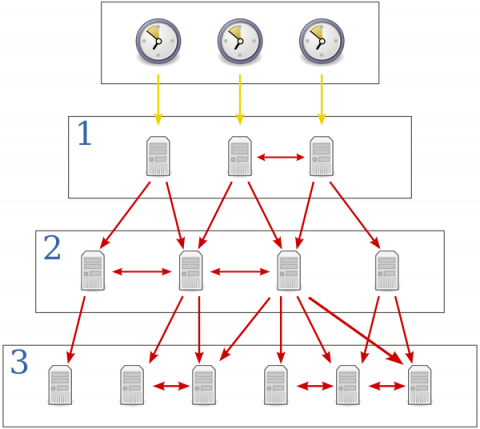
Find out how to effectively and easily monitor and troubleshoot NTPdaemon using Netdata.
Find out how to effectively and easily monitor and troubleshoot MongoDB using Netdata.
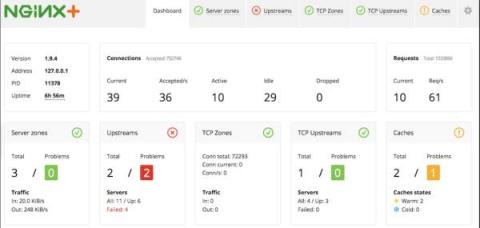
As a continuation of our series for monitoring web servers with NGINX and APACHE, let us find out how to effectively and easily monitor and troubleshoot NGINXPlus using Netdata!
Find out how to effectively and easily monitor and troubleshoot Dovecot using Netdata.
Find out how to effectively and easily monitor and troubleshoot CoreDNS using Netdata.
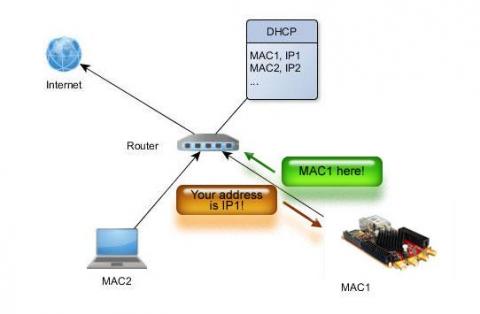
Find out how to effectively and easily monitor and troubleshoot Dnsmasq for DHCP using Netdata.
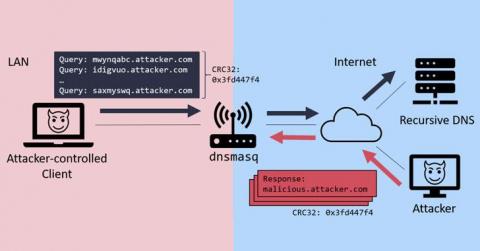
Find out how to effectively and easily monitor and troubleshoot Dnsmasq DNS Forwarder using Netdata.
Find out how to effectively and easily monitor and troubleshoot Postfix using Netdata.