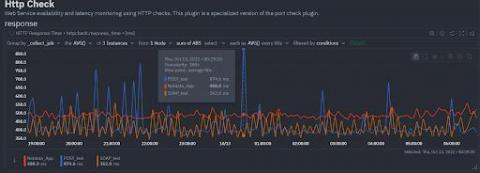
A month ago, we introduced unsupervised ML & Anomaly Detection in Netdata, the Anomaly Advisor. Today, we’re happy to announce that we’re bringing anomaly rates to every chart in Netdata Cloud. Anomaly information is no longer limited to the Anomalies tab and will be accessible to you from the Overview and Single Node View tabs as well. This will make your troubleshooting journey easier, as you will have the anomaly rates for any metric available with a single click.
As of v1.35.0 the Netdata Agent can now run Metric Correlations (MC) itself. This means that, for nodes with MC enabled, the Metric Correlations feature just got a whole lot faster! The Netdata Metric Correlations feature uses a Two Sample Kolmogorov-Smirnov test to look for which metrics have a significant distributional change around a highlighted window of interest.
Sometimes a hat is just a hat, the truth is just the truth, and the clearly most popular example of a category is plain to see. In this case, Ubuntu is the most popular Linux distribution currently available. With the operating system’s superior popularity also comes an amazing amount of community support.
Netdata’s new Anomaly Advisor feature lets you quickly identify potentially anomalous metrics during a particular timeline of interest. This results in considerably speeding up your troubleshooting workflow and saving valuable time when faced with an outage or issue you are trying to root cause.