Operations | Monitoring | ITSM | DevOps | Cloud
Elastic
Elastic Search 8.10: Powerful personalized search powered by a comprehensive connector catalog
Elastic Search 8.10 brings programmatic personalization of your search experiences to a new level while expanding the open code integration catalog with knowledge base and communication systems connectors. These new features allow customers to: Elastic Search 8.10 is available now on Elastic Cloud — the only hosted Elasticsearch® offering to include all of the new features in this latest release.
Getting started with OpenTelemetry instrumentation with a sample application
Application performance management (APM) has moved beyond traditional monitoring to become an essential tool for developers, offering deep insights into applications at the code level. With APM, teams can not only detect issues but also understand their root causes, optimizing software performance and end-user experiences. The modern landscape presents a wide range of APM tools and companies offering different solutions. Additionally, OpenTelemetry is becoming the open ingestion standard for APM.
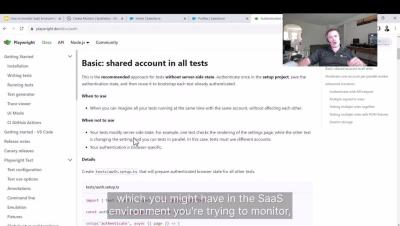
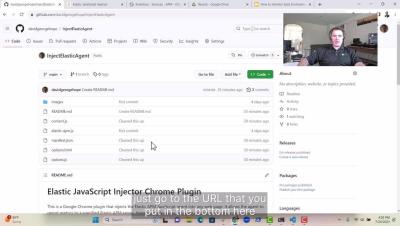
How to monitor SaaS Environments with a Google Chrome Plugin
Bringing speedups to top-k queries with many and/or high-frequency terms
Disjunctive queries (term_1 OR term_2 OR... OR term_n) are extremely commonly used, thus they are getting a lot of attention when it comes to improving query evaluation efficiency. Apache Lucene has two main optimizations for evaluating disjunctive queries: BS1 on the one hand for exhaustive evaluation, and MAXSCORE and WAND on the other hand to compute top hits.
How to Manually Instrument Java with OpenTelemetry (Part 1)
How to Manually Instrument Java with OpenTelemetry (Part 2)
Manual instrumentation of Java applications with OpenTelemetry
In the fast-paced universe of software development, especially in the cloud-native realm, DevOps and SRE teams are increasingly emerging as essential partners in application stability and growth. DevOps engineers continuously optimize software delivery, while SRE teams act as the stewards of application reliability, scalability, and top-tier performance. The challenge?
Auto-instrumentation of .NET applications with OpenTelemetry
In the fast-paced universe of software development, especially in the cloud-native realm, DevOps and SRE teams are increasingly emerging as essential partners in application stability and growth. DevOps engineers continuously optimize software delivery, while SRE teams act as the stewards of application reliability, scalability, and top-tier performance. The challenge?
How to deploy Hello World Elastic Observability on Google Cloud Run
Elastic Cloud Observability is the premiere tool to provide visibility into your running web apps. Google Cloud Run is the serverless platform of choice to run your web apps that need to scale up massively and scale down to zero. Elastic Observability combined with Google Cloud Run is the perfect solution for developers to deploy web apps that are auto-scaled with fully observable operations, in a way that’s straightforward to implement and manage.


