Operations | Monitoring | ITSM | DevOps | Cloud

uptime

The Uptime.com monitoring guide for launching your website

Websites are an amenity packaged as a utility. If your site isn’t reliable and fast, users have options to replace it and they probably will. How you build your site and how you maintain it impacts your site’s success. Regardless of whether you’re launching your website, relaunching, or even rebranding, you don’t have to break the wheel to build a solid website that can withstand the traffic and growth of your enterprise.

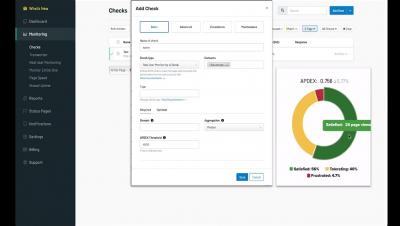
Why Uptime.com Chose Apdex as a Performance Monitoring Standard

Early Twitter was an adventure. Every day was an open question: would you be able to log in or did the next big story crash the platform? It was taking off and crashing and flying and crashing again. All in real time. It was an exciting time for the internet, and while everything has changed since then it got us thinking: why did we used to tolerate stuff just not working? And why do we still tolerate stuff not working?

Use Real User Monitoring to Optimize Real User Experience on Websites and Applications

What if I told you one of the most common mistakes businesses make is reporting on website performance without understanding user experience? What if I said there was much more to website performance monitoring than simply alerting you when your site is experiencing a downtime outage? No two websites – or baselines – are exactly the same.

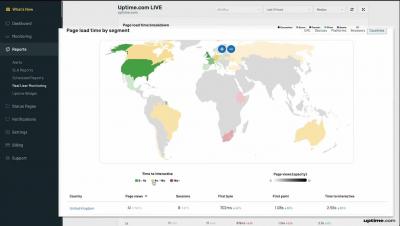
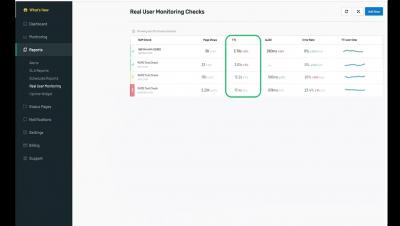
Uptime.com Real User Monitoring Report

Take an in-depth tour of the Uptime.com RUM report. Skip to each aspect of reporting with the timestamps below: Comprehensively understand your users – and your baselines. Organize RUM data by URL(s) or group URL(s) to track subdomains; segment data by devices, operating systems, browsers, countries, other geographies – to compare metrics within specific time windows to your website or application’s performance monitoring baselines.

How Your Web Monitoring Benefits From Multi-Channel Alerting

Have you ever had to purchase a CPU or a GPU? If so, you have probably come across the term “bottlenecking”. There is a certain threshold where output exceeds ability to process, and that can prevent optimal system functionality. One of the methods used in computing to overcome these bottlenecks is multi-threading, where requests are processed simultaneously by multiple threads. We can apply a similar principle to downtime monitoring.

10 Website Performance Statistics Every SRE Should Know For 2022

Two major shifts are simultaneously taking place in the world of website monitoring: the acceleration of digital dependence has increased the need for high-performing websites and the frequency (and severity) of downtime outages continues to climb. These shifts have made it more important than ever for businesses of all sizes and industries to monitor uptime and page speed.