Operations | Monitoring | ITSM | DevOps | Cloud

Sensu Check Metric Extraction with InfluxDB and Grafana

Nikki Attea talks about one of the endless permutations of metrics software you can pair with Sensu. She'll show you how to collect data using Sensu check output metric extraction, transform that data with a Sensu InfluxDB Handler, store the data in an InfluxDB time series database and visualize that data on a Grafana dashboard.

timeShift(GrafanaBuzz, 1w) Issue 78

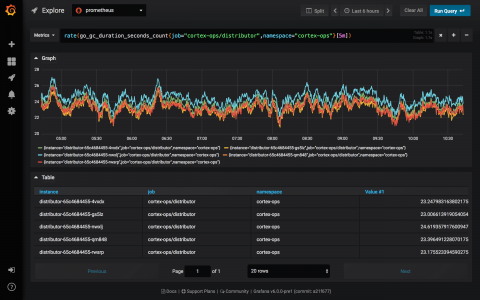
Grafana v6.0 Beta1 was released this week, and it’s packed with new features! This is one of the biggest updates to Grafana and introduces a new way to explore your data, support for log data, and includes tons of other enhancements. We hope you’ll give v6.0 Beta1 a try and let us know what you think. You can see a few of the highlights below, but check out all of the updates in the What’s new in Grafana v6 documentation.

timeShift(GrafanaBuzz, 1w) Issue 77

We’ve added more info on the upcoming talks at GrafanaCon LA and are excited to see the schedule shaping up. Grab your ticket while the last and join us February 25-26 for two days of great talks and hands-on workshops. This week we’re happy to share articles on how to view Azure Monitor Log Analytics data in Grafana, a proof of concept to visualize Fitbit data, how to quickly get up and running with Prometheus and more.