Operations | Monitoring | ITSM | DevOps | Cloud

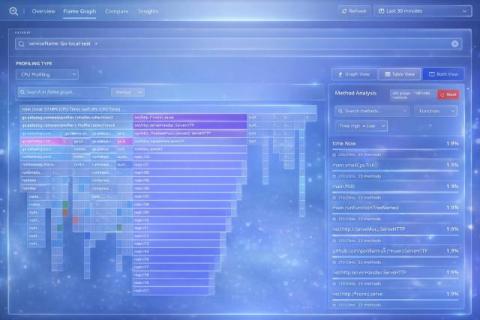
APM in 2026: The New Standard for Business Reliability and Growth

Global IT spending is expected to reach a record $6.08 trillion by 2026, with software investments growing by 15.2%. This shows how critical application performance has become for businesses today. For almost 80% of companies, even one hour of downtime can cost more than $300,000. In a world where every digital experience affects your revenue and brand reputation, keeping your applications performing well is no longer optional.

External Request Monitoring: The Silent Pillar Every APM Needs

The global market for application performance monitoring (APM) is growing fast. Market research shows the industry is expected to rise from about USD 7.52 billion in 2023 to nearly USD 19.62 billion by 2030, with a compound annual growth rate (CAGR) of around 15.1%. This rapid expansion reflects how digital transformation, hybrid cloud adoption, and third-party integrations are reshaping performance monitoring needs. It’s no longer enough to track just internal code paths and database queries.

Why Your APM Needs Observability - Metrics, Logs, and Traces Explained

Modern software applications are increasingly complex. Microservices, cloud infrastructure, and distributed architectures make it challenging for developers, DevOps engineers, and SREs to maintain high performance and a seamless user experience. Traditional Application Performance Monitoring (APM) provides critical insights into how applications perform, but alone, it often leaves blind spots when it comes to diagnosing issues or understanding the full system behavior.

10 Proven APM Best Practices to Reducing Latency and Improving Response Time

Speed defines user loyalty. Recent market research indicates that organizations adopting advanced application performance monitoring (APM) tools are achieving measurable gains in user engagement, retention, and revenue. “ A 2025 performance study found that businesses tracking latency and response time proactively reduced customer churn by up to 30%. ” As applications expand across distributed architectures, microservices, and cloud environments, performance gaps become harder to diagnose.

Application Performance Monitoring (APM) Guide: Monitor and Optimize Application Performance

Every millisecond your application takes to respond can decide whether a user stays or leaves. But here’s the catch, you can’t improve what you can’t see. Behind every slow page load, failed API call, or random spike in latency lies a story your application is trying to tell. Application Performance Monitoring (APM) is how you listen to that story.

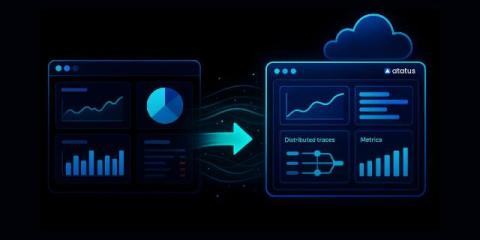
How Leading Businesses Achieved Greater Uptime with Atatus Monitoring

When every second of downtime can mean lost revenue and frustrated customers, leading businesses can’t afford to leave performance to chance. That’s why leading companies are turning to Application Performance Monitoring (APM) tools like Atatus, a Datadog alternative to keep their applications healthy, detect issues before customers do, and achieve higher uptime than ever. But how exactly are they doing it?

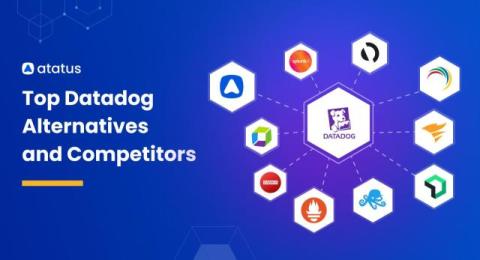
Datadog vs Splunk: A Side-by-Side Comparison [2025]

Datadog and Splunk are both leading tools for monitoring and observability. Each offers a range of features designed to help you understand and manage your data. Datadog provides tools for tracking application performance and analyzing logs in real-time. Splunk, meanwhile, is known for its powerful log analysis and search capabilities. In this post, we will compare Datadog and Splunk on important aspects like APM, log management, search capabilities, and more.

Node.js Monitoring in Serverless Environments - A Complete Guide

Serverless computing with Node.js is transforming how applications are built and scaled by removing the need to manage servers. However, serverless functions run for short durations and scale dynamically, making traditional monitoring ineffective. Effective monitoring is essential to track performance, detect errors, optimize cold starts, and control costs.

Why Does Your Node.js App Crash in Production and How Can You Fix it?

Node.js has become one of the most popular platforms for building scalable and high-performance web applications. Its event-driven, non-blocking I/O model allows developers to efficiently handle thousands of concurrent connections with minimal overhead. However, many businesses still face a critical challenge, Node.js applications often crash unexpectedly in production environments, causing downtime, lost revenue, and damage to brand reputation.

Diagnose slow database queries in Node.js: Why Monitoring is Essential?

Node.js is popular for building scalable applications because its non-blocking architecture can handle many requests at once. But when your app depends on a database, performance hinges on how efficiently queries run behind the scenes. Even a single slow database query can block the Node.js event loop, causing delayed responses, frustrated users, and cascading performance issues. Too often, teams only notice these problems after customers experience lag or timeouts.