Operations | Monitoring | ITSM | DevOps | Cloud

October 2023

Plan new architectures and track your cloud footprint with Cloudcraft by Datadog

In a rapidly expanding, highly distributed cloud infrastructure environment, it can be difficult to make decisions about the design and management of cloud architectures. That’s because it’s hard for a single observer to see the full scope when their organization owns thousands of cloud resources distributed across hundreds of accounts. You need broad, complete visibility in order to find underutilized resources and other forms of bloat.

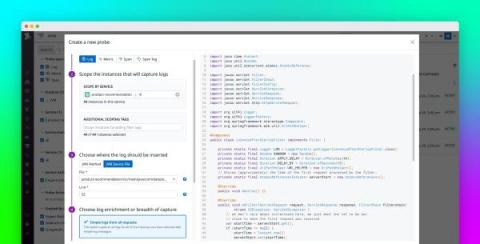
Use Datadog Dynamic Instrumentation to add application logs without redeploying

Modern distributed applications are composed of potentially hundreds of disparate services, all containing code from different internal development teams as well as from third-party libraries and frameworks with limited external visibility. Instrumenting your code is essential for ensuring the operational excellence of all these different services. However, keeping your instrumentation up to date can be challenging when new issues arise outside the scope of your existing logs.

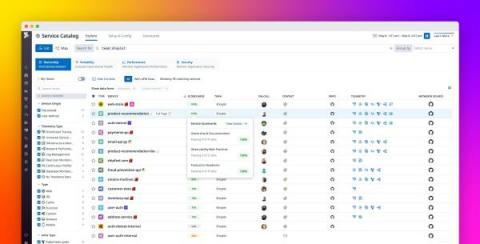
Prioritize and promote service observability best practices with Service Scorecards

The Datadog Service Catalog consolidates knowledge of your organization’s services and shows you information about their performance, reliability, and ownership in a central location. The Service Catalog now includes Service Scorecards, which inform service owners, SREs, and other stakeholders throughout your organization of any gaps in observability or deviations from reliability best practices.

Stream your Google Cloud logs to Datadog with Dataflow

IT environments can produce billions of log events each day from a variety of hosts and applications. Collecting this data can be costly, often resulting in increased network overhead from processing inefficiencies and inconsistent ingestion during major system events. Google Cloud Dataflow is a serverless, fully managed framework that enables you to automate and autoscale data processing.

Optimize your infrastructure with CloudNatix and Datadog

CloudNatix is an infrastructure monitoring and optimization platform for VMs, containers, and other cloud resources. Customers can use CloudNatix’s Autopilot feature to automatically configure and run infrastructure optimization workflows that allocate and run their resources more efficiently. CloudNatix can take action to auto-size Kubernetes and VM workloads, defragment Kubernetes clusters, and create harvest pods from unused VMs, among other key optimizations.

Understanding Request Latency with Profiling

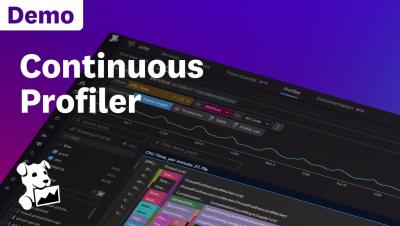
It can be hard to figure out why response times are high in Java applications. In my experience, when engineers investigate this type of issue, they typically use one of two methods: They either apply a process of elimination to find a recent commit that might have caused the problem, or they use profiles of the system to look for the cause of value changes in relevant metrics.

Datadog on Kubernetes Node Management

Datadog, the observability platform used by thousands of companies, runs on dozens of self-managed Kubernetes clusters in a multi-cloud environment, adding up to tens of thousands of nodes, or hundreds of thousands of pods. This infrastructure is used by a wide variety of engineering teams at Datadog, with different feature and capacity needs.

Visualize user interactions with your pages by using Scroll Maps in Datadog Heatmaps

When developing modern applications, product managers, designers, and website developers need to understand how users interact with web pages in order to guide those users through their desired journeys. For example, teams need to know if users ever see the content near the bottom of the page, where to place CTAs to ensure they are in high-traffic areas, and how to compare different pages based on user engagement.

Organize and analyze related session replays with Playlists in Datadog RUM

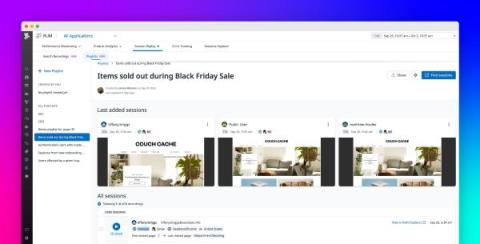
Datadog Session Replay in Real User Monitoring (RUM) enables customers to capture and visually replay the web and mobile experience of their end users. With Session Replay, customers can quickly find and address UX errors by seeing precisely what actions an end user took, the point where they got stuck, and the outcome encountered as a result. Session Replay allows for easier troubleshooting and debugging because it delivers visible, insightful context into frontend errors.

Ingest OpenTelemetry logs with the Datadog Agent

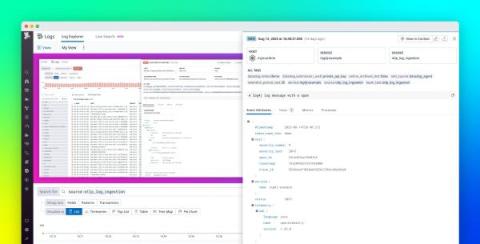
OpenTelemetry (OTel) is an open-source, vendor-neutral observability solution that provides a suite of components—including APIs, SDKs, and a data collector—that enable teams to collect and communicate telemetry data from cloud-native applications and services. OTel also defines the OpenTelemetry Protocol (OTLP), a standard for the encoding and transfer of telemetry data.

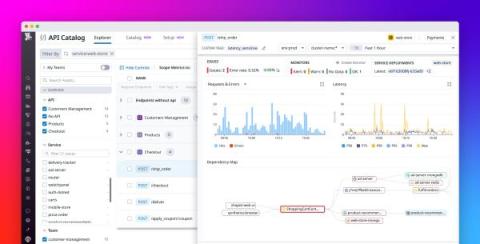
Manage API performance, security, and ownership with Datadog API Catalog

Today’s modern applications are made up of thousands of loosely connected private and publicly exposed APIs, each serving a specific function. This dynamic API landscape, in combination with the decentralized nature of microservice development, can be overwhelmingly challenging to manage—let alone govern or secure adequately. API sprawl is often created as a result, leading to fragmented or nonexistent internal API documentation, knowledge bases, and toolsets.

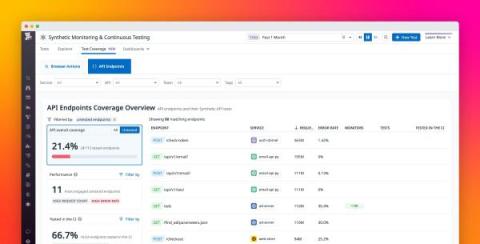
Improve your API test coverage with Datadog Synthetic Monitoring

As your applications grow, your teams may be faced with managing a complex, expanding mesh of potentially thousands of loosely connected APIs—each one a new point of failure that can be difficult to track and patch. API sprawl comes naturally in rapidly expanding, distributed applications, and the difficulty of maintaining centralized knowledge and toolsets for your APIs creates friction when teams need to leverage APIs they don’t own.

Best practices for creating custom detection rules with Datadog Cloud SIEM

In Part 1 of this series, we talked about some challenges with building sufficient coverage for detecting security threats. We also discussed how telemetry sources like logs are invaluable for detecting potential threats to your environment because they provide crucial details about who is accessing service resources, why they are accessing them, and whether any changes have been made.