Operations | Monitoring | ITSM | DevOps | Cloud

January 2024

Up Your Observability Game With Attributes

Splunk Observability Cloud includes powerful features which automatically identify patterns within your data to surface trends. The resulting insights tell you why some customers aren’t getting an optimal experience from your application, and how you can improve it. Unlocking these features requires attributes to be included with your application traces. But how do you know which attributes are the most valuable for your application and business?

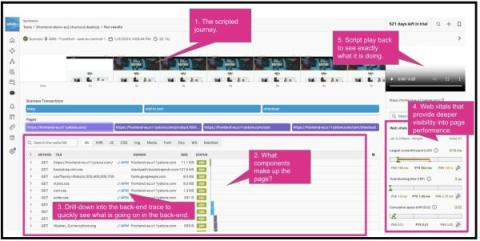
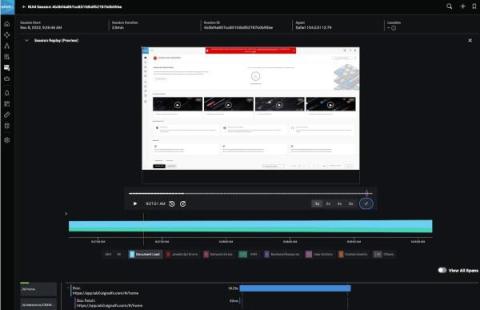
Why Knowing the Front-End and User's Experience of Your Platform is Key to Understanding How that Platform is Working

We have all been there. When you are trying to buy a ticket and the app crashes or loads the next web page when booking a holiday only to find it takes forever and appears to hang. Our frustration level increases and if it continues, we will exit and go elsewhere. With banking apps though, we won’t move straight away but repeated bad experiences here will be remembered and eventually will make us move.

When to Automate Recurring Events

“Is it worth it?” is probably the most common question customers ask business architects and value advisors. Whether it’s a software deployment or process improvement, customers want to be assured that the effort and risk of a project delivers real value. That is the question people in my line of work spend their days trying to answer. In many cases, the answer is complicated and requires a great deal of experience to explain.

Building the NextGen Factory with Splunk and Bosch Rexroth

For centuries there have been many wise sayings on how to deal with disruptions and prevail amidst uncertain circumstances. Read on to learn how Splunk and Bosch Rexroth are building the next-generation factory to help manufacturers elevate their resilience and take advantage of new market trends and operating models.

How to Customise Detectors for Even Better Alerting

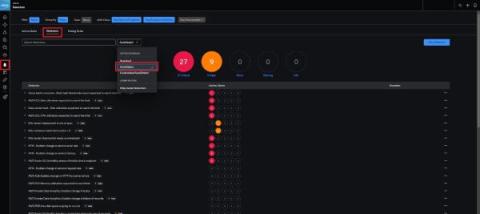
In the previous blog, we introduced what makes a bad alert and how being able to simply customise and fine-tune your detectors is critical to creating great alerts. The first category of detectors in Splunk Observability Cloud that we dived into was the out-of-the-box offering called AutoDetect. Customising and subscribing to these detectors is a great way to get up and running straight away with industry best-practice alerts and bring down MTTx.

Scale Your Splunk Cloud Operations With The Splunk Content Manager App

Effectively managing both public and private Splunk Apps across multiple Splunk environments poses a considerable challenge, demanding significant time and effort with the potential for tedious and manual tasks. Recognizing this complexity, the Splunk Cloud Service has been progressively introducing additional features and capabilities to streamline and simplify these intricate administrative responsibilities.

How to Create Great Alerts

We’ve all been guilty of it. Creating rules and filters to hide those alerts that, for the most part, are just noise. Only then to have notifications about a legitimate issue also get swept up by those same filters. There’s only so many times we can break concentration and disrupt productivity before getting fed up with false positives and ignoring everything completely.

AI at Splunk: Trustworthy Principles for Digital Resilience

There’s no doubt AI will radically reimagine the way we live, work and interact. It will empower new ways to solve business challenges and deliver customer value, but such a widespread impact requires a holistic approach. Building AI responsibly is one thing, but embedding trust into every aspect of our AI strategy is another entirely – and that’s what Splunk sets out to do.

Incident Response Plans: The Complete Guide To Creating & Maintaining IRPs

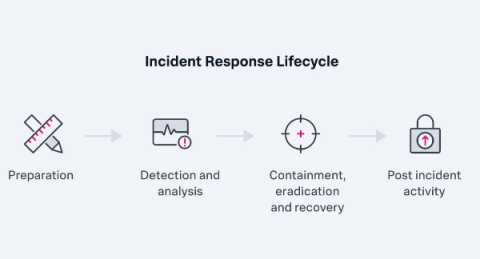
Speedily minimizing the negative impact of an information security incident is a fundamental element of information security management. The risks — loss of credibility in the eyes of users and other stakeholders, loss of business revenue and critical data, potential regulatory penalties — can significantly jeopardize your organization’s mission and objectives.

Observability and Telecommunications Network Management [Part 1]

The border between the management of telecommunications networks and the services that they support and the management of IT infrastructures and the applications that they support has always been a porous one. One might say that they are like two dialects of the same language rather than different languages. Nonetheless, these areas, whether characterised by technology or practice, are different and have, for the most part, been served by different vendors and products.

Data Architecture for Business Data & AI Projects

Like physical architecture, the architecture running your business data — any and compute-intensive AI projects — is important. This data architecture governs a very important part of your business: how well users can translate raw information into real knowledge and actionable insights. Today, your data architecture is getting perhaps more attention than ever before. And that’s all thanks to usable AIs that now exist.

How To Set Up Monitoring for Your Hybrid Environment

The modern IT landscape consists of many distributed systems, which can pose a challenge if you are responsible for the end-to-end performance of these systems. As a platform engineer today, that is exactly what the job requires. You must juggle between dozens of tools to meet SLAs. This is why a modern solution is needed to bridge the gap between disjointed infrastructure and application stacks…and this is why the Splunk Observability platform was born.

How to Monitor Your Hybrid Applications Without Toil

About seventy-two percent of businesses operate in a hybrid IT environment, mixing their cloud-based services with traditional on-premises infrastructure. These hybrid environments offer many benefits, from scale, speed, and flexibility to security, cost savings, and control, blending the best of both worlds.

The Importance of Traces for Modern APM [Part 2]

In part 1, we looked at how the design plan of traditional monitoring technologies depended heavily on properties of the systems that were intended to monitor and then showed how those properties began to be undermined by an increase in complexity, an increase which can ultimately be captured by the concept of entropy. In this part, we will explore how increased entropy forces us to rethink what is required for monitoring.

Shadow IT & How To Manage It Today

In the business world, shadow IT is a controversial topic. Gartner defines Shadow IT as any IT devices, software and services that are used outside or beyond the ownership or control of IT departments/ organizations. This includes: In a standard work environment, the IT department would be responsible for providing whatever IT solutions and work tools were needed across all business functions.

RED Monitoring: Rate Errors, and Duration

The RED method is a streamlined approach for monitoring microservices and other request-driven applications, focusing on three critical metrics: Rate, Errors, and Duration. Originating from the principles established by Google's "Four Golden Signals," the RED monitoring framework offers a pragmatic and user-centric perspective on service performance.