Operations | Monitoring | ITSM | DevOps | Cloud
April 2020
Announcing the Open Observability Conference
Today, I’m excited to announce the Open Observability Conference – a virtual event on May 27th at 11:00am EDT providing a platform for learning, sharing and discussion of open source observability technologies for DevOps teams around the globe. Register for the Open Observability Conference here.
Kubernetes Security Best Practices
Cloud-native is the new standard for modern applications. This usually means container-based applications, using the popular Docker and Kubernetes platforms, and increasingly also service mesh platforms such as Istio and Envoy. With that, container security in general—and Kubernetes security in particular—is at the forefront of engineers’ minds. Docker popularized containers based on the good-old but little-used LXC Linux containers.
Integration and Shipping Okta Logs to Logz.io Cloud SIEM
Company security usually depends on your ability to come up with a diverse set of passwords and then manage them. Remembering all of them is considered a tad too difficult for most mere mortals, so a number of password storage apps have emerged. But they too have to be secured, and ultimately results in inefficient access and flawed security. Single-sign on (SSO) is still preferred, but to make it effective, companies like Okta have to secure integration across a number of apps.
Shipping Multiline Logs with Filebeat
Multiline logs provide valuable information for developers when troubleshooting issues with applications. An example of this is the stack trace. A stack trace is a sequence of method calls that an application was in the middle of when an exception was thrown. The stack trace includes the line in question that encountered the error, as well as the error itself.
Tyto Care: Accelerating Telehealth in the Fight against COVID-19
At Logz.io, our team has the opportunity to partner with many cutting edge technology companies and products from different trades. Many have a crucial mission and help save lives worldwide. In the fight against the novel coronavirus, telehealth is one such sector. It compels us to do all we can to support these organizations by improving application accessibility and performance for users who need it. One of our customers epitomizes this—Tyto Care. Tyto Care is a healthcare pioneer.
10 Indispensable Amazon EKS Features and Updates You Ought to Know
Amazon’s Elastic Kubernetes Service (EKS) is the company’s managed option for Kubernetes clusters. We have several articles on using AWS and Kubernetes on our blog, and felt there was a need to highlight some of the key features that AWS EKS offers. Many of these features have been rolled out or updated over the last year. We have mentioned some of these features in other posts, such as our comparison of EKS with AKS and GKE.
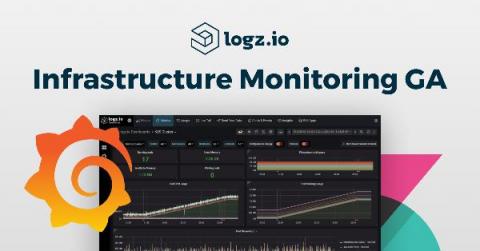
Introducing Logz io Infrastructure Monitoring GA!
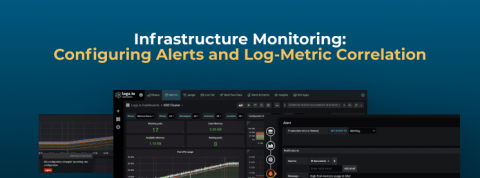
Logz.io Infrastructure Monitoring: Configuring Alerts and Log-Metric Correlation
If you’ve followed our latest blog posts, you’ll have learned how to send metric data to Logz.io and visualize that data on Infrastructure Monitoring – our Grafana-based metrics monitoring solution that we made Generally Available on Monday. At this point you’ll have some nice looking Grafana dashboards in your account.
Logz.io Infrastructure Monitoring: Building Grafana Visualizations
Yesterday, my colleague Mike Elsmore wrote a blog about sending metrics to Logz.io Infrastructure monitoring – now let’s analyze them by building Grafana visualizations! Once you’ve started to send metric data to Logz.io, how do you visualize and interpret that data so that it’s useful for you? In Logz.io Infrastructure Monitoring, we use Grafana to provide dashboards and bring meaningful information to light.
Logz.io Infrastructure Monitoring: Grafana and Kibana are Better Together
In the midst of a complex and challenging global environment, I’m proud and excited to announce General Availability for Logz.io Infrastructure Monitoring, our new metrics monitoring and analytics solution based on Grafana. Additionally, we’re supporting Early Availability for our new Distributed Tracing offering powered by Jaeger. The release represents a huge next step in our mission to provide the best open source for observability as a fully managed, cost-effective cloud service.
Collect and Analyze Kafka JMX Metrics with Logz io
Logging Python Apps with the ELK Stack & Logz.io
Logging is a feature that virtually every application must have. No matter what technology you choose to build on, you need to monitor the health and operation of your applications. This gets more and more difficult as applications scale and you need to look across different files, folders, and even servers to locate the information you need. While you can use built-in features to write Python logs from the application itself, you should centralize these logs in a tool like the ELK stack.
Grafana vs. Graphite
This blog post will pit Grafana vs Graphite against each other, two of the most popular observability tools on the market today. R&D organizations typically implement a wide technology stack. They include varying services, systems, or tools to support their production and development environments. Most, if not all, of these companies have SLAs requiring R&D to provide high availability solutions and the ability to respond to incidents in real time.
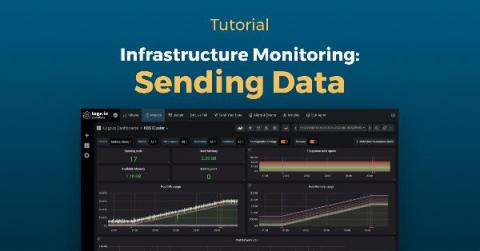
Logz.io Infrastructure Monitoring Tutorial: Getting Started Shipping Metrics
This Logz.io Infrastructure Monitoring tutorial will cover our latest product, our new metrics solution based on Grafana. Engineers monitor metrics to understand CPU and memory utilization for infrastructure, duration and serverless execution, or for network traffic. For more advanced metrics monitoring operations, teams can send custom metrics to monitor signals like the number of active users. Logz.io’s flagship product is Log Management, which delivers a fully-managed ELK Stack.
Overcoming Lucene Pitfalls in Kibana with Kibana Advisor
Even though search is the primary function of Elasticsearch, getting search right can be tough — and sometimes even confusing. To retrieve your data in the most efficient way from Elasticsearch, sometimes you’ll need to overcome some Lucene’s obstacles. While you need to familiarize yourself with Lucene Query Syntax for advanced Kibana use, Lucene’s implementation within Elasticsearch still has some challenges.
An Introduction to Azure Observability with Logz io
Best Practices for Monitoring Kubernetes using Grafana
Microservices and containers have taken the tech industry by storm. Kubernetes is one of the tools that has evolved to manage these new aspects of software development. It is an open-source system for automating deployment, scaling, and management of containerized applications. One of the biggest challenges that organizations face when adopting Kubernetes is performing monitoring tasks in this dynamic environment.
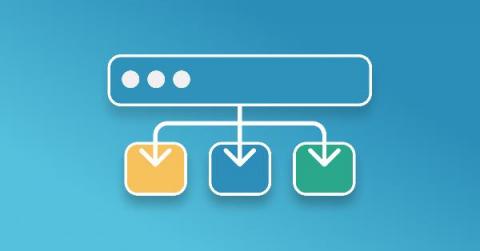
The 5 Best Open Source Load Balancers
Consider for a moment which fundamental pieces of technology enable the modern web. Odds are, you’re thinking about things like Javascript and HTTP—and yes, they are fundamental parts of the modern web. But, the often-overlooked component of this ecosystem that has truly enabled the web to scale to billions of users and transactions is load balancers.


