Operations | Monitoring | ITSM | DevOps | Cloud

The latest News and Information on Containers, Kubernetes, Docker and related technologies.

Kubecost and Qovery Team up to Offer Cost Monitoring for DevOps Teams

We are thrilled to announce our partnership with Kubecost, a game-changing provider of cost monitoring for Kubernetes clusters. This collaboration marks a new era in efficiency and cost-effectiveness for DevOps teams everywhere. With Kubecost's advanced monitoring capabilities integrated into our own Kubernetes deployment platform, we are empowering organizations to take control of their cloud-native infrastructure like never before.

How to optimize resource utilization with Kubernetes Monitoring for Grafana Cloud

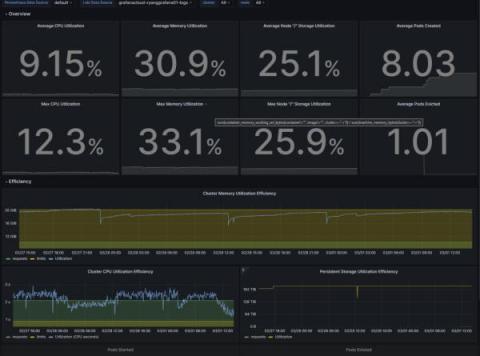
Overprovisioning or underprovisioning your Kubernetes resources can have significant consequences on both your budget and your app performance. By underprovisioning your Kubernetes infrastructure, you’ll end up with lagging, underperforming, unstable, or non-functional applications. On the opposite end of the spectrum, overprovisioning is a costly issue: Organizations spent almost $500 billion on cloud resources in 2022, yet an estimated 30% of those were wasted.

How We Designed Qovery To Manage Thousands of Kubernetes Clusters with a Single Control Plane

Deploying and managing applications in the cloud can be complex and time-consuming, especially when using Kubernetes. However, Qovery has made this process much easier with its platform abstracts away the complexity of Kubernetes and provides developers with the tools they need to manage their deployments. But how does Qovery manage thousands of Kubernetes clusters with a single control plane?

Kubernetes Logging

You'll notice that monitoring and logging don't appear on the list of core Kubernetes features. However, this is not due to the fact that Kubernetes does not offer any sort of logging or monitoring functionality at all. It does, but it’s complicated. Kubernetes’ kubectl tells us all about the status of the different objects in a cluster and creates logs for certain types of files. But ideally speaking, you won't find a native logging solution embedded in Kubernetes.

Monitoring with Custom Metrics

By kickstarting a monitoring project with Prometheus, you might realize that you get an initial set of out-of-the-box metrics with just Node Exporter and Kube State Metrics. But, this will only get you so far since you will just be performing black box monitoring. How can you go to the next level and observe what’s beyond? They are an essential part of the day-to-day monitoring of cloud-native systems, as they provide an additional dimension to the business and app level.

Epinio Meets s3gw

Since the very first version, Epinio has made use of an internal S3 endpoint to store the user’s projects in the form of aggregated tarballs. Those objects are then downloaded and staged by the internal engine’s pipeline and, finally, they are deployed into the Kubernetes cluster as consumable applications. Epinio makes use of S3 as an internal private service. In this scenario, S3 can be thought of as an internal ephemeral cache with the purpose of storing temporary objects.