Operations | Monitoring | ITSM | DevOps | Cloud

An (only slightly technical) introduction to Loki, the Prometheus-inspired open source logging system

Every application creates logs. Web servers, firewalls, services on your Kubernetes clusters, public cloud services, and more. For companies, being able to collect and analyze these logs is crucial. And the growing popularity of microservices, IoT, cybersecurity, and cloud has brought an explosion of new types of log data. That’s why log management is a huge $2-billion-plus market that’s growing 14% YoY.

Grafana 7.0 sneak peek: Inspect drawer lets you get raw data and download as CSV

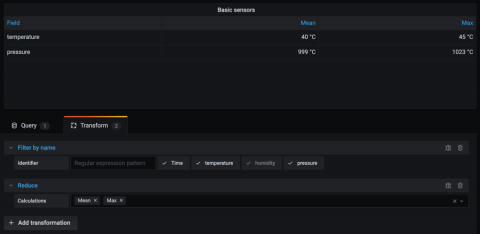
Grafana v7.0 is coming soon! Here’s another sneak peek of one of its features: the inspect drawer. The inspect drawer is a feature that every panel will support, including internal as well as external community plugins. In this new drawer, you will be able to view the raw data in a table format, apply some predefined transformations, and download as CSV. “Download as CSV” previously only existed as a custom feature for the Graph & Table panel.

Grafana 7.0 preview: New image renderer plugin to replace PhantomJS

Many Grafana users export images of their dashboard panels. This feature powers the ability to receive alerts with a rendered image of the panel attached, which is valuable for quickly spotting if something is about to go sideways in production. Since Grafana v2.0, when support for server-side rendering of dashboard panels as images was introduced, PhantomJS has served as the built-in image renderer that enables this feature.

How isolation improves queries in Prometheus 2.17

There are instances in life when isolation is actually welcome. One of those instances pertains to the I in the acronym ACID, which outlines the key properties necessary to maintain the integrity of transactions in a database. The time series database (TSDB) embedded in the Prometheus server has the C (consistency), the D (durability), and – somewhat debatable – the A (atomicity). But up until and including Prometheus v2.16, it did not have the I (isolation).

Improving Graphite rollup and runtime consolidation in Metrictank and Grafana 7.0 with lineage metadata

The Grafana and Metrictank/Graphite teams have been hard at work to deliver an exciting new feature for the upcoming Grafana v7.0 release: a rollup indicator and series lineage metadata breakdown for Metrictank. This blog will cover the new functionality around Metrictank metadata, the rollup indicator, and the lineage visualization coming in 7.0.

Grafana 7.0 sneak peek: Query history in Explore

Grafana v7.0 is coming next month! Here’s a sneak peek of one of its features: the query history in Explore. Query history lets you view the history of your querying. All queries that have been starred in the Query history tab are displayed in the Starred tab. This allows you to access your favorite queries faster and to reuse these queries without typing them from scratch.

How Cortex uses the Prometheus Write-Ahead Log (WAL) to prevent data loss

Since the beginning of the Cortex project, there was a flaw with the ingester service responsible for storing the incoming series data in memory for a while before writing it to a long-term storage backend. If any ingester happened to crash, it would lose all the data that it was holding.

Grafana 7.0 sneak peek: New table panel for dashboards

Grafana v7.0 is coming next month! Here’s a sneak peek of one of its features: a brand-new table panel. The current (old) table panel has accumulated a ton of feature requests over the years, and we are excited to finally close many of them in 7.0 with this new table panel. Among the many new things this panel can do is to include other visualizations inside cells. For example, you can configure a cell style (per column) to render the value as a bar gauge.

WFH tips: Slack hacks that will make you more productive

The COVID-19 pandemic has forced many companies to require employees to work from home. It’s a new normal for many, but at Grafana Labs our team has always recruited and operated with a remote-first culture in mind. To help everyone transition to a home office environment, we launched a new WFH series in which Grafana team members have been sharing their best advice for staying productive at home – yes, even if you have kids around.

Grafana v7.0 is coming soon! Check out this sneak peek of the auto grid layout

Grafana v7.0 is coming next month! Here’s a sneak peek of one new feature: the auto grid layout. This new 7.0 feature is for the gauge and stat panels. Before, stat and gauge only supported horizontal or vertical stacking: The auto layout mode just selected vertical or horizontal stacking based on the panel dimensions (whatever was highest).