What Happened to My Points?
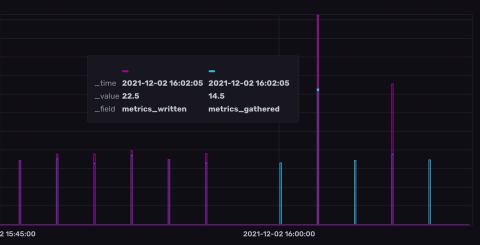
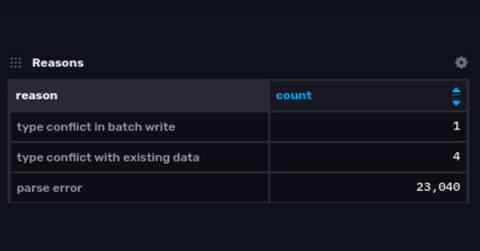
This article explores some of the ways that invalid data can be rejected when writing to InfluxDB and describes a new feature that makes it easier to know when and why that happens.


This article explores some of the ways that invalid data can be rejected when writing to InfluxDB and describes a new feature that makes it easier to know when and why that happens.
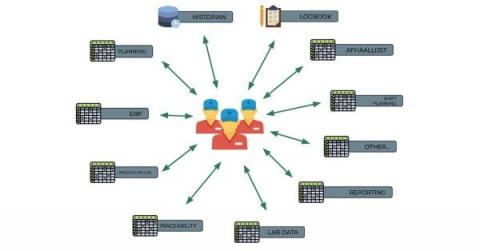
Founded in 1884 and located in Ghent, Belgium, Algist Bruggeman supplies fresh, liquid, and dried yeast to industrial, semi-artisanal, and artisanal bakeries, as well as to the beer, wine, and pharma industries. Algist Bruggeman is part of the Lesaffre Group, a key global player in fermentation for more than a century. Even with more than a century of industrial production behind it, Algist Bruggeman continues to evolve its manufacturing processes.
In this tutorial you will learn how to use the Flux query language to enrich time series data stored in InfluxDB by combining it with metadata stored in a relational database.
Telegraf has reached the ripe old age of V1.21.2. Thanks to community feedback and contribution, there have been many features added over the years. Lately, I have seen these questions pop up. If any of these questions plague your mind, have no fear — this blog is here to help! Here are my golden rules for maintaining best practices when building your Telegraf solution.
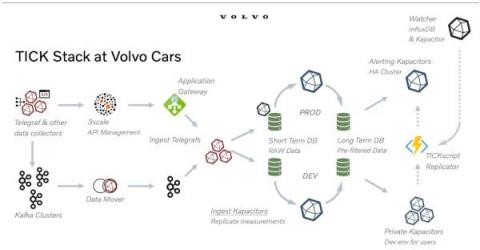
Production delays or stoppages are the bane of any manufacturer. When you’re a global automaker like Volvo, even the smallest delays can have significant ripple effects. But not even global leaders are immune to IT issues. This was the situation Volvo faced several years ago. It had a legacy DevOps monitoring solution in place for the previous 15–20 years, but that system no longer met the company’s needs. On the surface, it seems like a robust system.
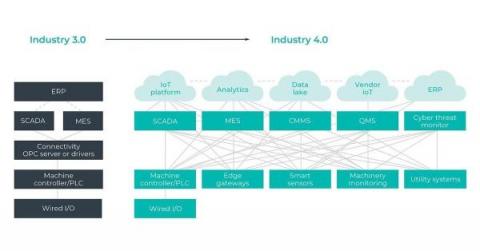
HighByte is an industrial software company based in Portland, Maine building Industry 4.0 based solutions that address the data architecture and integration challenges inherent in manufacturing. The company developed the first DataOps solution purpose-built to meet the unique requirements of industrial assets, products, processes, and systems at the Edge.
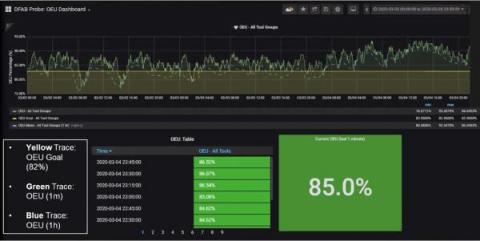
When your production line runs at nearly 100 percent capacity, even a momentary blip can cost your organization a packet. That’s why Texas Instruments is using InfluxDB to monitor its manufacturing operation and detect problems before they become costly.
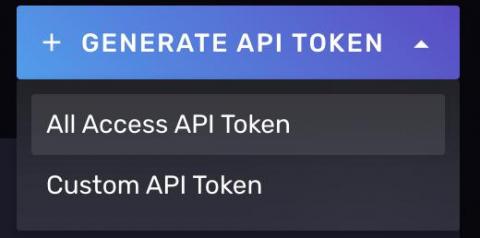
InfluxDB Cloud allows users to create API tokens that are used for authentication and authorization to sets of resources when interacting with our API. We recently made changes to the user interface so that after generating a token, you will need to immediately store it in a secure vault of your choosing for safekeeping. We made this change to conform to industry best practices around both token generation and retrieval.
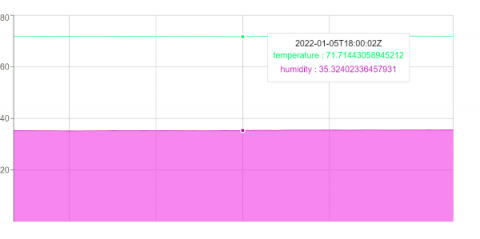
In this tutorial, you will learn how to create a custom data visualization with ReactJS using the Recharts charting library to display time series data stored with InfluxDB. To do this you will store some real-time data being recorded by some IoT sensors which record the temperature, humidity, and carbon monoxide levels of a room.
In an increasingly data-driven world, the ability to summarize and display data while making it easy to understand and actionable is more important than ever. Dashboards appear in all types of software with various approaches behind their design. Despite how they differ in appearance and the information they display, at a conceptual level all dashboards have the same goal and purpose.