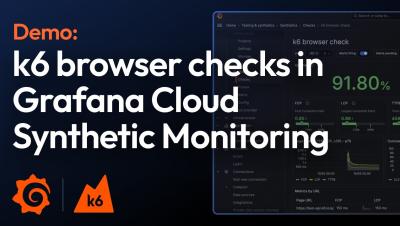
In this demo video, Virginia Cepeda, senior software engineer at Grafana Labs, walks through the k6 browser checks feature in Grafana Cloud Synthetic Monitoring.
In this video, Grafana Labs Staff Solutions Engineer Lionel Marks describes how to configure the OpenTelemetry Operator along with your Kubernetes cluster to automatically inject, configure, and package auto-instrumentation components that you can then monitor in Grafana Cloud Application Observability.
In this video, Grafana Developer Advocate Leandro Melendez describes how Bar gauges simplify data by reducing every field to a single value while choosing how Grafana calculates the reduction.
In this Community Call, Senior Software Engineer Trevor Whitney talks to us all about Explore Logs for Grafana Loki, an open-source app for visualizing logs from Loki in Grafana without needing to learn and write LogQL queries. He is joined by Senior Developer Advocates Nicole van der Hoeven and Jay Clifford. Community Calls are monthly meetings that are open to everyone interested in the development of Loki. They are an opportunity for software engineers working on Loki to discuss new features as well as for open-source users of Loki to ask questions.
Coming to you from NYC, Grafana ObservabilityCON 2024's keynote introduces the latest features and AI/ML developments in the Grafana LGTM Stack and Grafana Cloud that make it easier and faster for you to identify and resolve issues and get value from your observability practice.
In this video, Mat Ryer, Senior Principal Engineer at Grafana Labs, demonstrates how you can use the Explore Logs app to quickly gain insights from your data using a simple, point-and-click interface. Mat also discusses how you can use Explore Logs to drill down into your logs to investigate issues further, and how to use patterns to get rid of noise.
In this video, Mat Ryer, Senior Principal Engineer at Grafana Labs, provides an overview of the Explore Traces app for Grafana, which lets you automatically surface insights from your traces with an intuitive, point-and-click interface. Mat demonstrates how you can use the Comparison view to quickly identify the source of errors, and how to drill down to see a full trace in detail to gain a more comprehensive understanding of your system.
In this video, you will learn how to troubleshoot your application faster with Grafana Cloud Asserts, which provides contextual root cause analysis in Grafana Cloud. You'll learn how SLO alerts, the RCA (root cause analysis) Workbench, and prebuilt Grafana dashboards for Grafana Cloud solutions seamlessly work together to help you quickly investigate an issue.
Here are all the components of Loki explained so that you can figure out how many instances of each you need for a resilient Loki deployment. Senior Developer Advocates Jay Clifford and Nicole van der Hoeven talk you through what each component does and which ones are optional.
In this Community Call, Senior Software Engineer Christian Haudum talks to us about bloom filter changes for Grafana Loki, including the deprecation of the bloom compactor and a pivot towards creating bloom filters for structured metadata. Bloom filters are a probabilistic data structure that we're using to improve query performance in Loki. Community Calls are monthly meetings that are open to everyone interested in the development of Loki. They are an opportunity for software engineers working on Loki to discuss new features as well as for open-source users of Loki to ask questions.