Operations | Monitoring | ITSM | DevOps | Cloud

The latest News and Information on Observabilty for complex systems and related technologies.

Code Instrumentation Practices to Improve Debugging Productivity

Code instrumentation is closely tied to debugging. Ask one of the experienced developers and they will swear by it for their day-to-day debugging needs. With modest beginnings in the form of print statements that label program execution checkpoints, present-day developers employ a host of advanced techniques for code instrumentation. When carried out in the right way, it improves developer productivity and also reduces the number of intermediate build/deployment cycles for every bug fix.

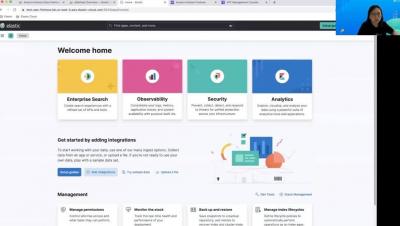
How to use Elasticsearch and Time Series Data Streams for observability metrics

Elasticsearch is used for a wide variety of data types — one of these is metrics. With the introduction of Metricbeat many years ago and later our APM Agents, the metric use case has become more popular. Over the years, Elasticsearch has made many improvements on how to handle things like metrics aggregations and sparse documents. At the same time, TSVB visualizations were introduced to make visualizing metrics easier.

Kentique - The Fragrance of Observability

What does observability smell like? For ages, humans have relied on sight to observe network, cloud, container, and data center traffic. Kentik is proud to usher in the next step in the evolution of network observability. Welcome to the age of scent! Introducing Kentique, a new fragrance from the creators of Kentik. Whether managing network infrastructure in the server room or entertaining guests at an AWS re:Invent afterparty, you need to smell the part – an aromatic infusion of routers, clouds, clusters, and telemetry dancing in a symphony of observability.

RCA Series: Root Cause Analysis in Observability with Elastic AIOps (2/4)

Root cause analysis empowers you to prevent issues from recurring that were revealed by your monitoring IT systems and online applications including eCommerce sites. See Elastic engineers walk you through applying four AIOps capabilities and accelerate MTTR by automatically categorizing logs, explaining log rate spikes, visually inspecting anomalous components in their context, and correlating slow or failed transactions with potential root causes.

Setting Up a Grafana Destination with BindPlane OP

BindPlane OP makes it easy to route your data to the correct destination. In this example see how we use a metric instance id, an API key, and zone from Grafana to setup the destination and ensure data is flowing.#telemetry #opensource #observability #grafana About ObservIQ: observIQ is developing the unified telemetry platform: a fast, powerful and intuitive next-generation platform built for the modern observability team. Rooted in OpenTelemetry, our platform is designed to help teams reduce, simplify, and standardize their observability data.

Scale Your Monitoring and Observability With Sensu

Sensu is the complete cloud monitoring solution for observability at scale, designed to give you rich insight and ensure that you know what’s going on everywhere in your system. With true multi-tenancy, an enterprise datastore that keeps pace as you scale, and streaming handlers to process all those events, you can rely on Sensu for cloud, container, and application performance monitoring that provides deep visibility into your entire infrastructure.

Unpacking the Hype: Navigating the Complexities of Advanced Data Analytics in Cybersecurity

The cybersecurity industry is experiencing an explosion of innovative tools designed to tackle complex security challenges. However, the hype surrounding these tools has outpaced their actual capabilities, leading many teams to struggle with their complexity and struggle to extract value from their investment.