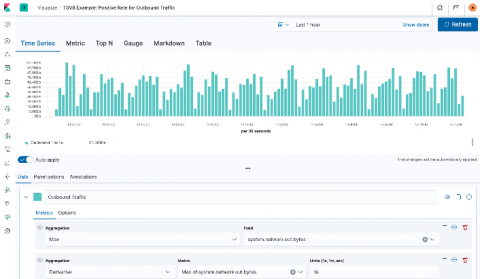
When working with observability data, a good portion of it comes in as time series data — things like CPU or memory utilization, network transfer, even application trace data. And the Elastic Stack offers powerful tools within Kibana for time series analysis, including TSVB (formerly Time Series Visual Builder). In this blog post, I’m going to attempt to demystify rates in TSVB by walking through three different types: positive rates, rate of change, and event rates.
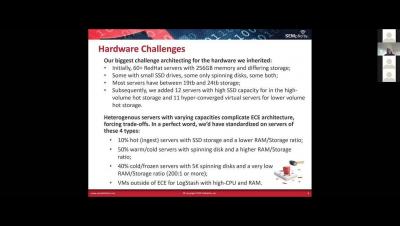
Elasticsearch allows you to store, search, and analyze large amounts of structured and unstructured data. This speed, scale, and flexibility makes the Elastic Stack a powerful solution for a wide variety of use cases, like system observability, security (threat hunting and prevention), enterprise search, and more. Because of this flexibility, effectively architecting your deployment’s data storage for scale is incredibly important.
Confession: I am a security practitioner. I am also a mom. What I am not is a homeschool teacher. Earlier this year, I spoke to the 5th- and 6th-grade classes at my son’s Innovation Day about cybersecurity. I discussed what it means to be a cybersecurity practitioner and how the practice of cybersecurity affects everyday life.
Many mature security teams look to the MITRE ATT&CK® matrix to help improve their understanding of attacker tactics, techniques, and procedures (TTPs) and to better understand their own capabilities relative to these common adversarial approaches. With the release of Elastic Security 7.6, Elastic SIEM saw 92 detection rules for threat hunting and security analytics aligned to ATT&CK.
We’re excited to announce the release of Elastic Cloud Enterprise (ECE) 2.5! This release improves the experience of managing your deployments with a dedicated coordinating layer, support for snapshot lifecycle management (SLM), and more.