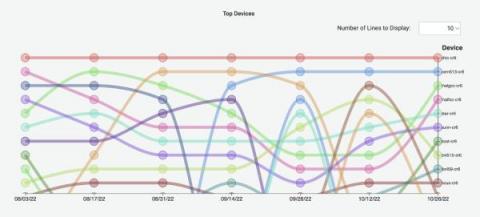
Fact: The Security Operations team at Grafana Labs loves logs. They are a key pillar of observability for many reasons, such as how they are stuffed full of details to help us diagnose the “why?” when things go wrong. This is especially true when the information pertains not to a series of unfortunate events, but instead to an adversary trying to cause us harm.
In 2019, KCB Bank Uganda reviewed its systems and came to a startling realization: Due to outdated monitoring processes, its services could be down for hours before anyone was alerted internally. This downtime led to frustrated consumers, a rise in customer service complaints, and a decline in revenue.
Over the last few years, the Grafana open source project has grown at an eye-watering pace, with more than 1 million active Grafana instances now in the wild. With that growth, our processes have had to run to keep up. This is especially true when it comes to how frequently we release new versions of Grafana. Currently we cut.
Here at Grafana Labs, one of the things we’re always working on is making Grafana more consistent. Given the increased adoption of Grafana around the world and the number of users and authentication providers we support, we wanted to create better defaults for login and email fields.
For Formula 1, speed is about more than just how fast you go around the track. It’s also about having data at your fingertips in real time to make critical improvements before, during, and after the race. “Formula 1 is one of the most fascinating data-driven sports,” said Anshul Sharma, Senior Product Manager at Microsoft. “It’s so competitive that even one tenth-second advantage can change the outcome of the race.”
As part of our efforts to improve the security of Grafana, we introduced a long-awaited feature in the latest Grafana 9.3 release that enhances Grafana’s OAuth 2.0 compatibility. The new Grafana OAuth token improvements, which are available in Grafana OSS, Grafana Cloud, and Grafana Enterprise, ensure that the user is not only logged into Grafana, but they’re also authorized by the OAuth identity provider.
As Grafana has grown from a visualization platform to an observability solution, we’ve added many tools along the way. These tools are dedicated to help you throughout the software development life cycle, whether you are trying to prevent incidents, you are monitoring your application or infrastructure, or if you are in the middle of an incident.
We all know about the great things Grafana dashboards can do, and configuring them as code makes it possible to get even more out of them. These days, Grafana resources can mostly be managed as code in a declarative manner, which enables code review, code reuse, and in general, better workflows. This guide presents a few as code tools you can use to declaratively manage Grafana resources, plus some tips and tricks on how to incorporate them efficiently into your own use cases.