Windows is widely used by developers, businesses, and individuals alike. Renowned for its adaptability, security, and reliability, the operating system is a preferred choice for servers, desktops, and embedded devices. It also holds a significant presence in the cloud, serving as the foundation for numerous major websites and applications.
While we built Grafana Loki as an open source log aggregation system that is cost effective and easy to operate, let’s face it: sometimes there is no time or bandwidth to mess around with self-managing and self-hosting. Luckily there’s the fully managed Grafana Cloud observability stack for log management. “Grafana Cloud is a no-BS platform. The engineering costs of hosting it ourselves would be much higher," says Jameel Al-Aziz, a software architect at Paradigm.
Grafana Cloud constantly evolves to include new, cutting-edge features for end-to-end observability. In fact, just last month at ObservabilityCON 2023, we made a number of updates to our fully managed observability platform, including the general availability of Grafana Cloud Application Observability, Grafana SLO, and Adaptive Metrics.
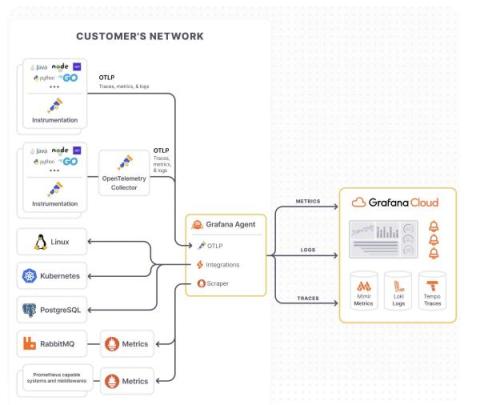
Grafana Agent v0.38 has hit the digital shelves just before the holiday season! 🧑🎄 The elves over at Grafana Labs have been quietly working on Grafana Agent, with more than 50 updates for all SREs and developers to use — no matter if you’re on the naughty or nice list. This includes new features, improvements, bug fixes, and significant ease-of-use changes.
Here's the Grafana Office Hours with Matt Durham and Paul Balogh, where we discuss Grafana Agent Flow mode and how it's better than static mode: https://youtube.com/live/-_SsFLoJvoc
And check out the documentation for flow mode here: https://grafana.com/docs/agent/latest/flow/