Operations | Monitoring | ITSM | DevOps | Cloud

Logging Python Apps with the ELK Stack & Logz.io

Logging is a feature that virtually every application must have. No matter what technology you choose to build on, you need to monitor the health and operation of your applications. This gets more and more difficult as applications scale and you need to look across different files, folders, and even servers to locate the information you need. While you can use built-in features to write Python logs from the application itself, you should centralize these logs in a tool like the ELK stack.

Grafana vs. Graphite

This blog post will pit Grafana vs Graphite against each other, two of the most popular observability tools on the market today. R&D organizations typically implement a wide technology stack. They include varying services, systems, or tools to support their production and development environments. Most, if not all, of these companies have SLAs requiring R&D to provide high availability solutions and the ability to respond to incidents in real time.

Logz.io Infrastructure Monitoring Tutorial: Getting Started Shipping Metrics

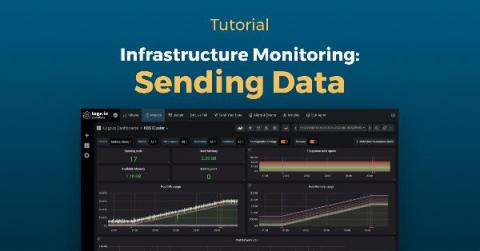
This Logz.io Infrastructure Monitoring tutorial will cover our latest product, our new metrics solution based on Grafana. Engineers monitor metrics to understand CPU and memory utilization for infrastructure, duration and serverless execution, or for network traffic. For more advanced metrics monitoring operations, teams can send custom metrics to monitor signals like the number of active users. Logz.io’s flagship product is Log Management, which delivers a fully-managed ELK Stack.

Overcoming Lucene Pitfalls in Kibana with Kibana Advisor

Even though search is the primary function of Elasticsearch, getting search right can be tough — and sometimes even confusing. To retrieve your data in the most efficient way from Elasticsearch, sometimes you’ll need to overcome some Lucene’s obstacles. While you need to familiarize yourself with Lucene Query Syntax for advanced Kibana use, Lucene’s implementation within Elasticsearch still has some challenges.

Best Practices for Monitoring Kubernetes using Grafana

Microservices and containers have taken the tech industry by storm. Kubernetes is one of the tools that has evolved to manage these new aspects of software development. It is an open-source system for automating deployment, scaling, and management of containerized applications. One of the biggest challenges that organizations face when adopting Kubernetes is performing monitoring tasks in this dynamic environment.

The 5 Best Open Source Load Balancers

Consider for a moment which fundamental pieces of technology enable the modern web. Odds are, you’re thinking about things like Javascript and HTTP—and yes, they are fundamental parts of the modern web. But, the often-overlooked component of this ecosystem that has truly enabled the web to scale to billions of users and transactions is load balancers.

While You Work from Home, Double Down on Elasticsearch Security

As engineers, you and I have a responsibility to protect both our customers’ and our respective companies’ data. But unlike our office networks that adhere to strict security protocols and a well-defined perimeter, our home networks usually fall short. And now that most of us are at home waiting out the COVID-19 pandemic, it’s time to revisit of logging in and Elasticsearch security during while you work from home.

Shipping AWS S3 CloudWatch Metrics to Logz.io

AWS S3 buckets are an indisputably powerful—and extremely well-organized—DevOps tool. Standing for “simple storage service,” the S3 is the lowest tier offered for AWS storage, but it is also the most indispensable. S3 buckets store data for immediate recall, the most active components in Amazon’s arsenal of storage options. They can store a variety of developer applications and up to five terabytes of data each.

Launching the Community COVID-19 Dashboard Project

Let Data Shed Some Light in the Midst of Uncertainty The burden the COVID-19 novel coronavirus has placed on the world is enormous. There’s a great thirst for information and clarity. So, we at Logz.io have decided to offer a Community COVID-19 Dashboard Project, so that everyone can better understand how the outbreak impacts the world and their region. We see that as a community effort.

Tutorial: Shipping Docker Metrics to Logz.io

Docker is an essential bridge in modern DevOps. Despite Kubernetes overtaking Docker on orchestrating containers, the Docker container itself remains the standard and likely will for the foreseeable future. We developed the Docker Metrics collector to operate as its own container that will run Metricbeat using the modules you are running in real time. Now, in addition to the Docker module, we are now releasing an AWS module for operations in the cloud.