Operations | Monitoring | ITSM | DevOps | Cloud

Latest Posts

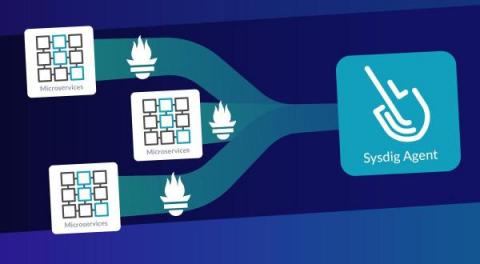
Easily Monitor Google Cloud with Sysdig's Managed Prometheus

Google Cloud provides its own set of metrics for monitoring applications, services, and instances. There are a huge number of metrics – more than 1,500 different ones just for GCP monitoring! While this is great, dealing with such a number can also be overwhelming. Filtering, pulling, exploring, and storing the metrics that you really need can be an enormously time-consuming task, and a big challenge.

Bypassing Network Detection with Graftcp

What is the difference with similar tools? Detect graftcp with Falco Conclusion A new network open source tool called graftcp (GitHub page) has been discovered in everyday attacks by the Sysdig Threat Research Team (TRT). Nowadays, threat actors try to improve their techniques by using new tools (as we mentioned in the PRoot article) to enhance the compatibility of their code to hit as many targets as possible and hide their traces properly.

Monitoring with Custom Metrics

By kickstarting a monitoring project with Prometheus, you might realize that you get an initial set of out-of-the-box metrics with just Node Exporter and Kube State Metrics. But, this will only get you so far since you will just be performing black box monitoring. How can you go to the next level and observe what’s beyond? They are an essential part of the day-to-day monitoring of cloud-native systems, as they provide an additional dimension to the business and app level.

Prometheus and Kubernetes Metrics Ingestion

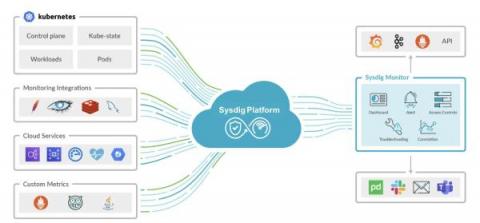
Prometheus is one the the most acclaimed solutions for Kubernetes monitoring. There are multiple add-ons and exporters that facilitate the task of pulling Kubernetes metrics. Sysdig Monitor is a cloud-native observability platform that helps businesses with the whole observability lifecycle. It provides simplicity at all times, allowing companies to rapidly pull their Kubernetes and Prometheus metrics without headaches.

What's New in Sysdig - February 2023

What’s New in Sysdig is back again with the February 2023 edition! I am Michael Rudloff, an Enterprise Sales Engineer based in the United Kingdom, and I am very excited to update you with the latest feature releases from Sysdig. This month, Sysdig Secure brings a couple of new features. We have added reports to Risk Spotlight – Risk Spotlight can show you which packages with vulnerabilities are currently in use in a running container across your whole Kubernetes environment.

The Cloud Monitoring Journey

Monitoring is not a goal, but a path. Depending on the maturity of your project, it can be labeled in one of these six steps of the cloud monitoring journey. You will find best practices for all of them and examine what companies get from each one. From classic virtual machines to large Kubernetes clusters or even serverless architectures, companies have adopted the cloud as a mainstream way to provide their online services.

Prometheus Alertmanager best practices

Have you ever fallen asleep to the sounds of your on-call team in a Zoom call? If you’ve had the misfortune to sympathize with this experience, you likely understand the problem of Alert Fatigue firsthand. During an active incident, it can be exhausting to tease the upstream root cause from downstream noise while you’re context switching between your terminal and your alerts. This is where Alertmanager comes in, providing a way to mitigate each of the problems related to Alert Fatigue.