Operations | Monitoring | ITSM | DevOps | Cloud

Latest News

Data Center Energy Consumption Trends of 2024

Data centers are the backbone of our increasingly interconnected world. They power everything from streaming services to AI, handling vast amounts of data every second. However, this technological advancement comes at a cost, with energy consumption being a significant concern. In fact, data center energy consumption is forecasted to double by 2026. As we venture further into 2024, it is important to review some of the key trends around energy consumption in data centers.

How to Monitor & Identify Google Meet Performance Issues

Virtual meetings have become essential for businesses, connecting teams and enabling collaboration from anywhere. Google Meet has been a reliable platform for these meetings, but ensuring smooth performance requires some know-how. In this article, we'll break down how to monitor and identify Google Meet performance issues. Whether you're an IT professional, network admin, or remote user, this guide is tailored to help you optimize your virtual meetings.

Every second counts in our UI

Downtime has always been shown in minutes, hours, and days but for shorter downtimes you would see "0m" even if the actual downtime was less than a minute. We've updated the UI to show downtime in seconds. This means no more manually calculating brief outages — you’ll see exactly how long the system was down :) Did you know you can add notes to downtime periods?

Introducing Relational Fields

We’re excited to bring you relational fields, a new feature that allows you to query spans based on their relationship to each other within a trace. Previously, queries considered spans in isolation: You could ask about field values on spans and aggregate them based on matching criteria, but you couldn’t use any qualifying relationships about where and how the spans appear in a trace.

Lessons learned from running a large gRPC mesh at Datadog

Datadog’s infrastructure comprises hundreds of distributed services, which are constantly discovering other services to network with, exchanging data, streaming events, triggering actions, coordinating distributed transactions involving multiple services, and more. Implementing a networking solution for such a large, complex application comes with its own set of challenges, including scalability, load balancing, fault tolerance, compatibility, and latency.

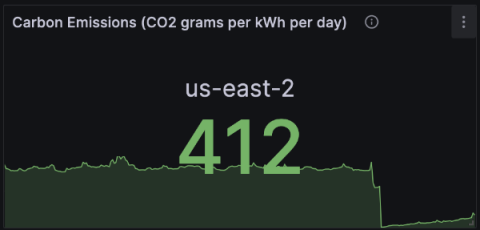
Going green: How to monitor your cloud carbon footprint using Kepler, Prometheus, and Grafana

At this point, the technical and operational benefits of cloud computing are pretty much indisputable. But the cloud industry, as a whole, still has a long way to go in one critical area: sustainability. In fact, as shocking as it may sound, it’s estimated that cloud data centers have a greater carbon footprint than the entire aviation industry. Ida Fürjesová and Niki Manoledaki, both software engineers at Grafana Labs, are passionate about helping to change that.

Significance of SQL Query Consumption Analysis

In the digital era, where data reigns supreme, the ability to extract meaningful insights from vast datasets has become indispensable. Though we have many data sources and data processing languages, SQL (Structured Query Language) stands as a cornerstone in this realm, empowering analysts, and data scientists to navigate through intricate databases with ease.

10 Hottest Network Monitoring Support Topics

Network monitoring is perhaps the most indispensable tool in a network professional’s toolbox because it offers a deep understanding of IT infrastructure. Many IT pros use network monitoring daily the same way a teenager stares for hours at TikTok. Progress WhatsUp Gold has been making IT lives easier since its beta release in 1996. Here are the ten most popular how-to videos to help you make the most out of WhatsUp Gold.

The Top 15 Real-Time Dashboard Examples

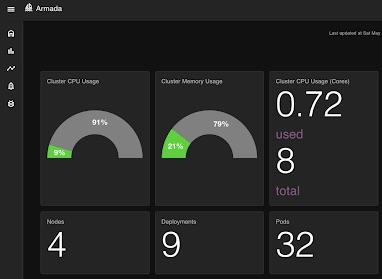
Monitoring your data with dashboards and visualizations is perfect for improving the efficiency of your team and facilitating data-driven decisions from insights. They provide a different perspective to your data and by utilizing this data and trends you can clearly view if your system, application, or server is performing optimally, and if it isn’t performing as expected you can analyze where the issue is and promptly rectify this.