Operations | Monitoring | ITSM | DevOps | Cloud

Augmenting MSP Helpdesk Support: 5 Workflows

Managed Service Providers (MSPs) are the backbone for many businesses, ensuring that IT systems run smoothly and efficiently. They offer a cost-effective alternative to building an in-house tech team, often allowing companies to leverage cutting edge expertise without the significant expense and responsibility associated with expanding headcount.

Harnessing AI for Cybersecurity: Beating AI Attackers at Their Own Game

In the rapidly evolving landscape of cybersecurity, AI-powered attackers are becoming increasingly sophisticated. To counter these threats, organizations must adopt advanced security technologies that leverage AI technology as part of a multi-layered approach to security.

Snowflake data visualization: all the latest features to monitor metrics, enhance security, and more

In 2020, we introduced the Snowflake Enterprise data source plugin for Grafana, allowing users to seamlessly pull data from the Snowflake cloud-based data storage and analytics service into Grafana dashboards. Available for Grafana Enterprise and Grafana Cloud users, it’s a powerful way to not only query and visualize Snowlake data, but to do so alongside other data sources, so you can discover correlations and other meaningful insights within minutes.

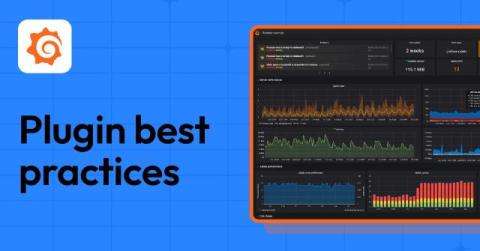
6 tips to improve your Grafana plugin before you publish

Whether they help you tap into external data sources or add a new visualization type to your dashboard, plugins are a powerful way to customize and extend the value of Grafana. There’s a rich (and constantly evolving) ecosystem of Grafana plugins you can choose from today. While some of these plugins are created and maintained by the Grafana Labs team, many of them are contributed by our commercial partners and community members.

How to reduce expenses on monitoring: be smarter about data

Monitoring can get expensive due to the huge quantities of data that need to be processed. In this blog post, you’ll learn the best ways to store and process monitoring metrics to reduce your costs, and how VictoriaMetrics can help. This blog post will only cover open-source solutions. VictoriaMetrics is proudly open source. You’ll get the most out of this blog post if you are familiar with Prometheus, Thanos, Mimir or VictoriaMetrics.

Happy 10th Birthday Kubernetes!

As Kubernetes celebrates its 10th anniversary, it’s an opportune moment to reflect on the profound impact Kubernetes has had on the cloud technology landscape. Since its inception, Kubernetes has revolutionized the way we deploy, manage, and scale containerized applications, becoming the de facto orchestration platform for today’s cloud-native ecosystem.

Application Observability And Its Role In Modern Software Development

Over the last few decades, software systems have grown complex due to the emergence of cloud-native architectures and multi-cloud environments. On the one hand, this makes it difficult to detect issues faster in the deployed application. It also requires intricate coordination between development, DevOps, and SRE teams, as they are also expected to speed up the whole software delivery process.

Open Telemetry 101 - A Primer

OpenTelemetry is an open-source observability framework designed to capture distributed traces and metrics from applications and services. It provides a standardized way to collect, process, and export telemetry data to various backends like tracing systems, monitoring platforms, and logging tools. OpenTelemetry, currently an incubating project at the Cloud Native Computing Foundation, is the merger of two popular observability projects: OpenTracing and OpenCensus.

Building on Legacy: How Government Agencies Can Consolidate Tools with Automation

Tool sprawl, further compounded by the inflexibility of legacy tools, poses a major challenge for government IT teams. As agencies work to deliver the digital services their constituents demand, their digital ecosystems have grown to comprise numerous apps, systems and microservices, all specific to the individual IT components of the experience. With disparate tools and systems leading to siloed insights, higher costs, and increased complexity, it’s easy for technical debt to get out of hand.

Scaling Data Collection: Solving Renewable Energy Challenges with InfluxDB

For data-critical and data-intense sectors, like energy and renewables, access to data can be a make-or-break situation. As the complexity of the systems underpinning energy operations increases, collecting and analyzing that data is more challenging than ever before. Therefore, understanding what data sources are necessary, where they sit in the tech stack, and how they scale across an organization ‌is crucial for obtaining the insights energy companies need to maintain and optimize operations.