Operations | Monitoring | ITSM | DevOps | Cloud

Metric Correlations using unlimited data for monitoring and observability

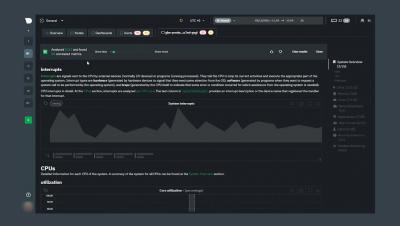
Correlate your monitoring metrics to make even better decisions about how to handle incidents in your infrastructure using our Metric Correlations. You can now select an unlimited amount of time to troubleshoot all of your monitoring metrics. Netdata’s free, open-source monitoring agent works with Netdata Cloud to help you monitor and troubleshoot every layer of your systems to find weaknesses before they turn into outages.

How to use Netdata Cloud for infrastructure observability

In this video, we cover how Netdata Cloud provides scalable infrastructure monitoring for any number of distributed nodes running the Netdata Agent. Monitor any system in your infrastructure including physical or virtual machines (VM), containers, cloud deployments, or edge / IoT devices. Netdata’s free, open-source monitoring agent works with Netdata Cloud to help you monitor and troubleshoot every layer of your systems to find weaknesses before they turn into outages.

Using Netdata's alerts smartboard for monitoring systems' health and performance

The alerts smartboard gives you high-level information for every node you are monitoring with Netdata Cloud. In this video, you will learn how to navigate through the alerts smartboard as well as what each alert means. Netdata’s free, open-source monitoring agent works with Netdata Cloud to help you monitor and troubleshoot every layer of your systems to find weaknesses before they turn into outages.