Netdata Meetup: Real World Scenario on How to Install and Monitor from Scratch
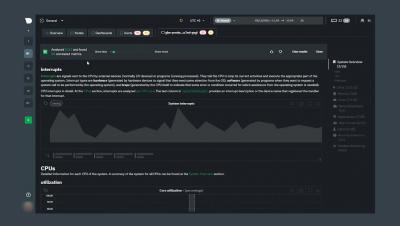
In our first Netdata Meetup, Thiago Marques will present and show you how to install Netdata from scratch on a specific host and demonstrate how to understand navigating through the many, in-depth Netdata dashboards. Thiago will also cover understanding metric distribution. Monitoring is not only to visualize collected data, which is why we will show where host notifications are, and how to access A.I. to simplify even more the correlation between issues and hardware/software.