Operations | Monitoring | ITSM | DevOps | Cloud

Creating your first health alarm in Netdata

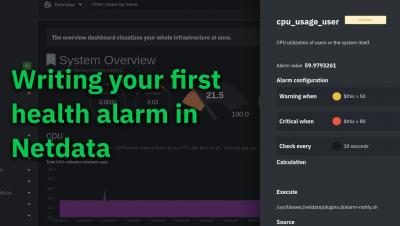
The per-second metrics and interactive visualizations in the Netdata Agent don’t mean much if you don’t know what you should be looking at, or whether anything is going wrong on your node in the first place. That’s why Netdata has a built-in health watchdog to notify you when metrics show an anomaly or full-blown incident that demands your immediate attention. Every Netdata Agent comes with hundreds of preconfigured charts that you don’t need to edit in order to take advantage of, but you may want to create your own based on your infrastructure, node, workload, or applications.

Go from 0 to monitoring in minutes with Netdata

Netdata is zero-configuration monitoring. It’s a principle that we’ve stood behind since the project’s beginning, when it was only our CEO Costa trying to solve a “painful, real-world problem,” and it’s one we stand by today. Our insistence on zero-configuration guides every product decision we make, every grooming process, and every React component our frontend teams design.

Introducing composite charts and Metric Correlations

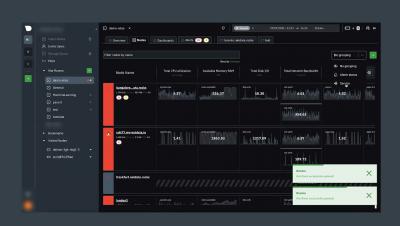
We're really excited about supercharging Netdata Cloud's infrastructure monitoring experience with composite charts. These charts look just like the ones you're familiar with, but feature real-time, per-second aggregated metrics from any number of distributed nodes from across your infrastructure. You can still pan, zoom, and highlight to your heart's content while also changing the aggregate function, filtering nodes, or jumping straight into single-node dashboards for root cause analysis.

Install Netdata on Linux in two minutes

We've tried really hard to make Netdata's open-source monitoring and troubleshooting Agent as simple and hassle-free as possible. This includes installation, which involves a single command, a few minutes of your time, and zero configuration. Once you've installed Netdata, you'll have access to thousands of metrics on hundreds of interactive charts that update every second, with zero configuration required. It'll even auto-detect your favorite services, like an Nginx web server or MySQL database, and collect metrics from those.

Netdata's standard dashboard

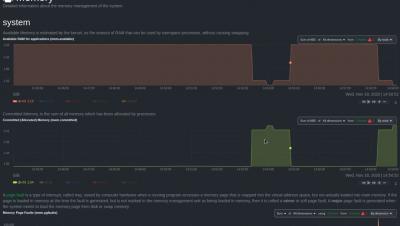
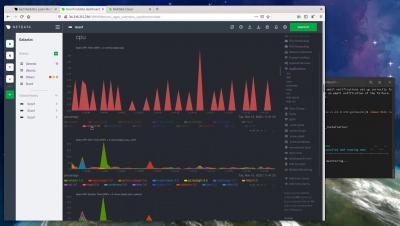
In this video, we’ll take a look at the Netdata's real-time dashboard, which has hundreds of charts, designed by both our team and the community. We’ll cover the elements related to the dashboard, such as contexts, dimensions, menus, and even raised alarms. By default, Netdata listens at port 19999. So, to get to the dashboard, open a web browser and enter your SERVER-IP ADDRESS plus port number or localhost plus port number.