Setting Up Your Private Location
Check out our free trial, no credit card required: https://uptime.com/go/home
#monitoring, #saas, #downtime, #uptime, #nomore404, #outage, #enterprisesbusiness


Check out our free trial, no credit card required: https://uptime.com/go/home
#monitoring, #saas, #downtime, #uptime, #nomore404, #outage, #enterprisesbusiness
Check out our 14-day free trial, no credit card required: https://uptime.com/accounts/register
#monitoring, #saas, #downtime, #uptime, #nomore404, #outage, #enterprisesbusiness
Check out our free trial, no credit card required: https://uptime.com/go/home
#monitoring, #saas, #downtime, #uptime, #nomore404, #outage, #enterprisesbusiness
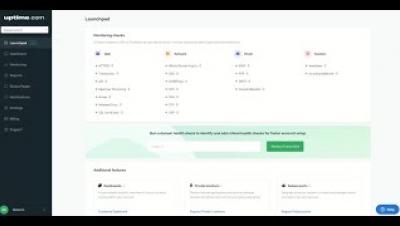
For more information on our Launchpad, view our support documentation: https://support.uptime.com/hc/en-us/articles/6108994761372-What-is-the-Uptime-com-Launchpad-
Check out our free trial, no credit card required: https://uptime.com/go/home
#monitoring, #saas, #downtime, #uptime, #nomore404, #outage, #enterprisesbusiness
03:06 Scheduling Reports
Check out our free trial, no credit card required: https://uptime.com/go/home
#monitoring, #saas, #downtime, #uptime, #nomore404, #outage, #enterprisesbusiness
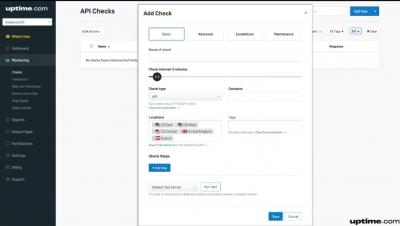
For more information on our API check, view our support documentation: https://support.uptime.com/hc/en-us/articles/360019552700-API-Check-Use-Cases-and-Examples
00:26 Web Checks
00:31 HTTP(S) Check
01:13 Transaction Check
01:45 API Check
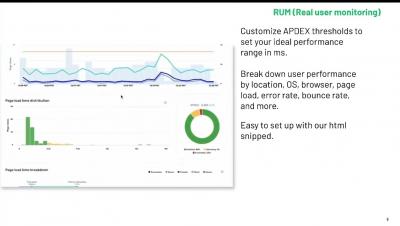
02:38 RUM Check
03:12 Malware and Virus Checks
03:37 SSL Check
04:00 Network Checks
04:04 WHOIS/Domain Expiry Check
04:19 DNS Check
04:43 Ping (ICMP) Check
04:59 NTP Check
05:22 SSH Check
05:34 TCP/UDP Port Checks
05:54 Email Checks
05:59 IMAP, POP, SMTP and Domain Blacklist Checks
06:37 Custom Checks