Operations | Monitoring | ITSM | DevOps | Cloud

Introducing Braintrust: The exclusive network of engineering leaders shaping the future

In an era of unprecedented change, the role of an engineering leader has never been more demanding. Yesterday’s priority was scaling teams, while today’s is twofold: deploying AI responsibly and measuring the true impact of it all. The challenges are immense, and for the first time in a long time, the playbook is being written in real-time. That’s why today, we are thrilled to announce the launch of Braintrust, a new community from Cortex.

Understand how AI is affecting your engineering team with Cortex's AI Impact Dashboard

Rolling out a powerful AI tool like GitHub Copilot is a big win for any engineering leader. But because it’s such a significant investment, leadership will inevitably ask if it was worth the cost. Until now, answering this was nearly impossible. While GitHub provides adoption stats, connecting that data to real-world performance metrics like cycle time or code quality has been a manual, frustrating process. We built the Cortex AI Impact Dashboard to provide a clear answer.

Your metrics, your way: Announcing custom views in Engineering Intelligence

Every engineering organization measures success differently. A dashboard that’s perfect for one team might be meaningless for another. While out-of-the-box views for DORA are a great starting point, leaders need the ability to define and share the specific combination of metrics that matter most to their business. Without this, you're either forcing your teams to conform to generic reports or wasting time rebuilding the same views every week.

Announcing the AI chief of staff for engineering leaders

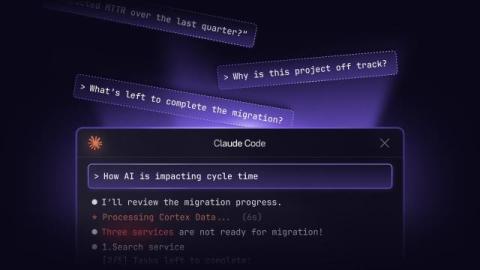
You see MTTR creeping up, but you don’t know why. You could ask your teams, but that means meetings, pulling people off projects, and waiting days for answers. What if you could just…ask? We’re excited to introduce the new strategic AI chief of staff for engineering leadership, powered by the Cortex MCP. By connecting your Engineering Intelligence data with your scorecards and standards, the MCP allows you to have a strategic conversation about your organization’s performance.

Introducing Magellan: The AI data engine that builds your IDP

Building a catalog used to be a project. It meant months of tracking down owners, untangling dependencies, and manually piecing together a picture of your architecture. It was a tedious, thankless process that delayed the value of your Internal Developer Portal (IDP) before you even got started. Now, it’s a coffee break. We’re excited to introduce Magellan, our new AI-powered data engine designed to build your catalog and get your IDP live in minutes.

A new era for your developer portal: The Cortex MCP is now generally available

Here's a scenario every on-call engineer knows too well: a critical incident fires for a service you’ve never seen before. Your first ten minutes are a frantic scramble across wikis and Slack channels just to answer the most basic questions: Who owns this? What does it do? Where are the runbooks? By the time you’re oriented, the incident has escalated.

How engineering leaders can adopt and lay the foundation for AI with confidence

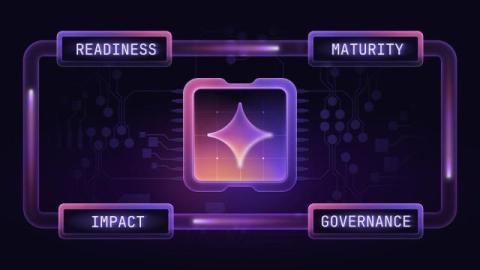
AI is transforming how software is written and operated. Every day, engineering teams are discovering new ways to accelerate development, reduce toil, and push the boundaries of innovation. But this acceleration makes it easy to forget a fundamental truth: speed without guardrails creates risk, especially when implementing the AI-powered tools that dominate today's news cycles.

The future of IDPs in an AI-first world

Over the last few months, I’ve had countless conversations with my peers about one topic: the rise of AI coding assistants. I know this isn’t exactly breaking news, and I’m sure you’ve had these conversations as well. But there’s a reason the common coffee chat today is 10 percent small talk and 90 percent about the AI-first world that we live in. Tools like GitHub Copilot, Cursor, and Devin are fundamentally changing how we write software.

Debugging Microservices in Production with Distributed Tracing

Your production checkout flow just started returning 500 errors. Six microservices handle checkout. Logs show errors in three of them. Which service broke? Which error happened first? What caused the cascade? Traditional debugging doesn't work. You can't attach a debugger to production. Searching logs across six services gives thousands of lines with no obvious connection. By the time you correlate timestamps and trace IDs manually, customers have abandoned their carts.