Operations | Monitoring | ITSM | DevOps | Cloud
Observability
The latest News and Information on Observabilty for complex systems and related technologies.
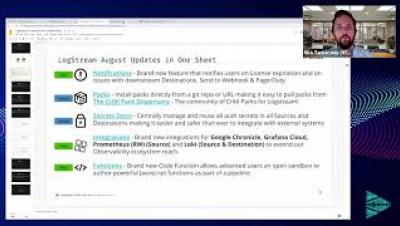
SE Office Hours: What's new with LogStream for August 2021?
Full-cycle observability with the Elastic Stack and Lightrun
An application running in production is a difficult beast to tame. Most experienced developers–ones who spent enough late nights or Saturday mornings trying to break apart a nasty production bug–will try and create the clearest possible picture for their later selves while writing their code, so that they could understand what’s actually going on in the system during an incident.
Honeycomb Is All-In on OpenTelemetry
OpenTelemetry (or “OTel”) helps you get your instrumentation started quickly, and it helps you get the most out of that telemetry data by providing flexible exporting options. As a result, it’s emerging as the new standard for instrumentation. To that end, today we’re sharing more insight into the work we’ve done (and are doing) to enable a path for all Honeycomb users toward OTel adoption. We hope you’ll be as excited as we are to embrace these open standards!
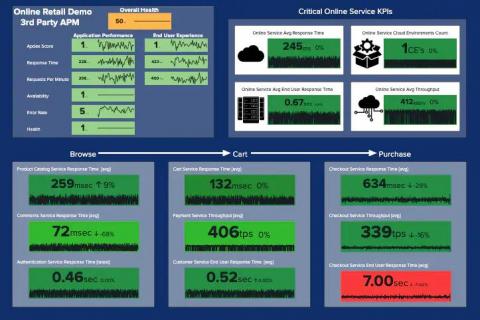
3rd Party APM: Unite Your Legacy APM Data on Your Journey to Observability!
Today you likely have one or more legacy APM (Application Performance Monitoring) solutions. You are moving from a monolithic architecture to microservices, and you are accelerating your journey to Cloud, and you need to deliver at speed with scale and quality to your customers. Sadly, visibility into these results are limited to each of these solutions and their interfaces.
How to Debug Remotely in VS Code
You’re likely familiar with local debugging—the ability to go through your code line by line to find and eliminate bugs. However, with the ever-increasing complexity of development environments, working efficiently with remote systems is becoming more necessary. In this case, “remote” can mean any machine you don’t have native OS-level access to, such as Virtual Machines, Docker containers, and entirely separate devices accessed over the network.
New Solutions to New Observability Needs
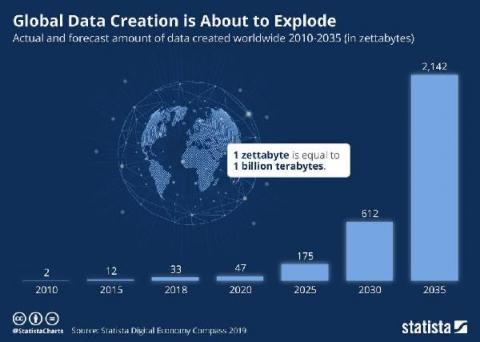
“Observability,” is the process in DataOps of recording data generated by digital systems as they go about their processes. There are some great companies in the observability space, generating a whopping $17 billion annually, and contributing a significant portion to the modest 2.5 quintillion bytes of data created every year.
Verify GKE Service Availability with new dedicated uptime checks
Keeping the experience of your end user in mind is important when developing applications. Observability tools help your team measure important performance indicators that are important to your users, like uptime. It’s generally a good practice to measure your service internally via metrics and logs which can give you indications of uptime, but an external signal is very useful as well, wherever feasible.
Connecting Your Data with Tanium and LogStream
Why Observability Requires a Distributed Column Store
Honeycomb is known for its incredibly fast performance: you can sift through billions of rows, comparing high-cardinality data across thousands of fields, and get fast answers to your queries. And none of that is possible without our purpose-built distributed column store. This post is an introduction to what a distributed column store is, how it functions, and why a distributed column store is a fundamental requirement for achieving observability.


