Operations | Monitoring | ITSM | DevOps | Cloud

Logit.io

How Do I View My Elasticsearch Mappings?

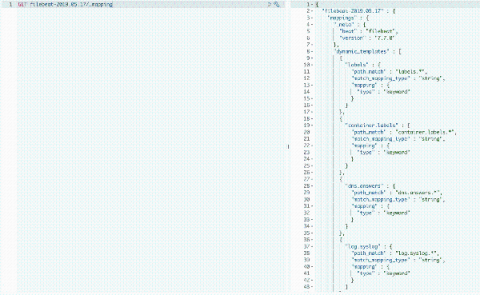
There are two ways you can view the current mappings on your Logit ELK Stacks. One way is to use dev tools in Kibana. You can access Kibana from any of your dashboards by choosing from your dashboard Stack settings > Access Kibana. You can also search for a specific mapping of an Index name. For example if we wanted to see the mappings for the a Filebeat index name we can run the following to return only the desired mappings.

Closer Integration Announced For Azure Event Hub

We're happy to announce that we have just launched our improved integration for the Azure Event Hub, allowing DevOps & Security professionals to send log data for analysis easier than ever. This announcement comes as Microsoft’s Azure Event Hub reaches its highest global popularity as a data ingestion service. The integration ensures best-in-class performance across a variety of use cases using Azure.

How To Pick The Right Type of Log Data Visualisation

Data visualisations allow users to organise and present log data in a practical, usable, and sensible manner. This tool in log management ensures that the data collected communicates real-time, actionable insights that will support timely and informed decision-making. Knowing which types of visualisation best suits a particular data set is critical in giving data visualisation optimal business value. Here is how to pick the right type of log data visualisation. Pie charts

Platform Speed Increased Between 5x & 10x With NVMe Upgrade

We are pleased to announce that all users can now benefit from having their stacks hosted on NVMe (Non-Volatile Memory Express) SSDs. NVMe is one of the newest high-performance networking technologies changing the landscape of scalable infrastructure and assisting in decreasing infrastructure costs on a revolutionary scale.

Logit.io Announce New Dashboard Design

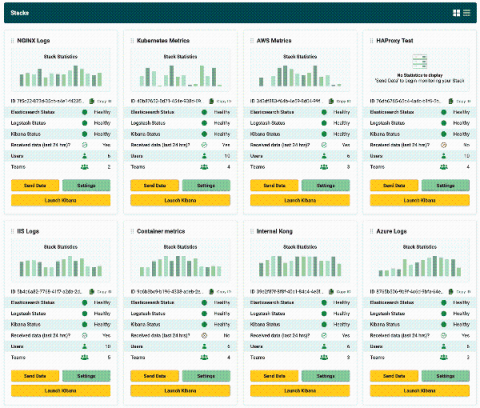
We're happy to announce that we've just launched our newly designed dashboard for our logs & metrics platform, allowing DevOps & security professionals to see their vital metrics quicker than ever before. Our team has been keen to respond to the needs of our users through undertaking dedicated research which informed the creation of this latest update to the platform's design. This new design provides improved real-time feedback to users managing & creating new ELK stacks.

How Can I Check My ElastAlert Rule is Configured Correctly?

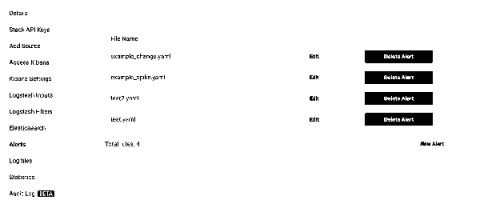
Making sure that your ElastAlert yaml file is formatted and configured correctly. All of the below points will prevent alerts from being fired but there may not be an error message associated with the problem. It is possible you may need to contact support to investigate this issue for you. Make sure to proof read the rule you have written to ensure that it is what you expect to see as most of the issues regarding ElastAlert not working correctly is related to the points above.

logit.io

Logit is an ISO 27001 certified centralised logging and metrics management company. Our platform delivers you with a fully customised log and metrics solution based on Elasticsearch, Logstash and Kibana which is scalable, secure and compliant.