Operations | Monitoring | ITSM | DevOps | Cloud

Logit.io

The Best Graphite Dashboard Examples

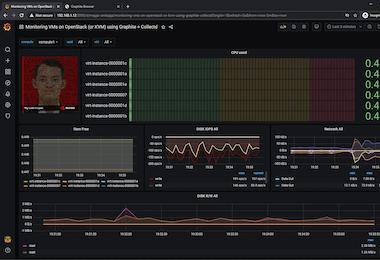
Graphite provides time-series metrics in an open-source database. With Graphite dashboards, you can see key performance indicators (KPIs) as well as other metrics visually. Dashboards typically display data as graphs, charts, and tables and can be customized to meet the specific needs of an organization. Using dashboards, organizations can monitor and analyze various aspects of their performance, such as system utilization, application performance, and resource utilization, using web interfaces.

The Best OpenSearch Dashboard Examples

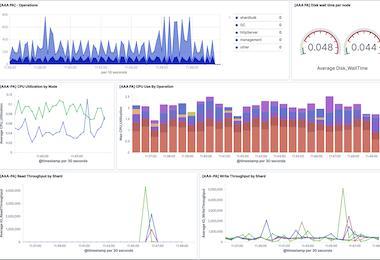
OpenSearch dashboards are a powerful tool for visualising and exploring data stored in an OpenSearch-compatible data store such as Elasticsearch. With OpenSearch's intuitive interface and advanced analytical tools, this visualisation tool makes it easy to gain insights into your data and monitor and alert upon key metrics. Throughout this article, we'll look at some of the most impressive OpenSearch dashboard examples that showcase it’s capabilities and versatility.

Kubectl Cheat Sheet

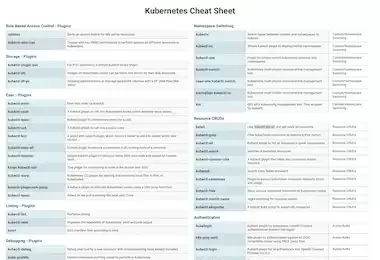
In the world of container orchestration, Kubernetes has become the de facto standard. Despite its simplicity in some respects, it has also introduced new levels of complexity in the deployment and management of distributed applications and services. To assist you with understanding the most common kubectl commands & plugins, we've created a cheat sheet as a reference for operations engineers, software engineers, and cloud infrastructure managers who use Kubernetes primarily.

The Leading Sumo Logic Alternatives

Using Sumo Logic, you can analyze both metrics and logs simultaneously. Developed in 2010, this solution provides a powerful query language and scheduling support. Sumo Logic's production monitoring features provide visibility into production issues. Instead of manually writing alerts, the platform offers pre-configured alert templates (which Logit.io also offers), which makes setting up alerts easier and faster.

What Is Observability?

In today's complex, multi-cloud environments, IT and engineering teams are under increasing pressure to respond to errors affecting their entire system. Therefore, IT operations, DevOps, and SRE teams are all striving to gain complete observability across these increasingly complex and diverse computing environments. But what exactly does observability mean?

The Top New Relic Competitors

Platforms like New Relic simplify enterprise cloud complexity, accelerating digital transformation, and simplifying cloud management. Their company serves over 10,000 businesses worldwide with AIops, distributed tracing, browser monitoring, infrastructure monitoring, and synthetic monitoring solutions. As a result of New Relic's lack of onboarding support, some engineers have complained about burnout while implementing the solution.

A Guide To Opentelemetry Collector

This article will give you a quick overview of some of the key attributes you should know in order to get started with leveraging the OpenTelemetry collector for your next telemetry project. As an integral component of any project that involves distributed tracking, the OpenTelemetry Collector plays an important role. Simply put, it is helpful to know that the collector itself is a data pipeline service that collects telemetry data.

The Leading Dynatrace Alternatives & Competitors

The Dynatrace platform is a software-driven monitoring platform that simplifies enterprise cloud complexity and accelerates the pace of digital transformation for enterprises. There are many top solutions on the market, but Dynatrace is one of the most popular for its ability to monitor both mobile apps and real users simultaneously. By offering a shared platform for understanding metrics, Dynatrace also helps developers, operations, and business teams improve performance.