Add Custom Markers from the Query UI
When it comes to observing systems, it helps to have tools that quickly and efficiently allow you to highlight events, anomalies, or simply changes to the code base. Enter Markers.


When it comes to observing systems, it helps to have tools that quickly and efficiently allow you to highlight events, anomalies, or simply changes to the code base. Enter Markers.
While logs can tell us whether a specific request failed to execute or not and metrics can help us monitor how many times this request failed and how long the failed request took, traces help us debug the reason why the request failed, or took so long to execute by breaking up the execution flow and dissecting it into smaller events.
If you’re feeling too busy or overwhelmed to instrument your code, we are here for you. We’ve talked many times about the value of instrumentation, and how it’s necessary to instrument your code properly to have access to the kind of data you need to get real observability. Instrumenting your code can mean a lot of things, but in particular it means you have to augment it in many different places, which is time-consuming.
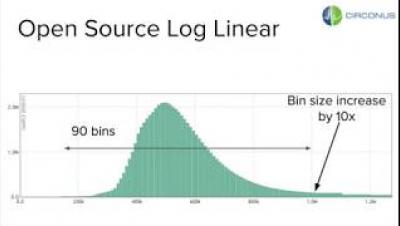
How do you capture and organize billions of measurements per second such that you can answer a rich set of queries effectively (percentiles, counts below X, aggregations across streams), and you don’t blow through your AWS budget in minutes? To effectively manage billions of data points, your system has to be both performant and scalable. How do you accomplish that? Not only do your algorithms have to be on point, but your implementation of them has to be efficient.
You’ve always been able to get observability for your Ruby apps by instrumenting them with our SDK, affectionately known as libhoney. Unfortunately, instrumenting code you’ve already written is nobody’s favourite job. If only there were some way to automate the repetitive parts, so you could get instant insight into what your app is doing in production, and then focus your effort on augmenting that insight with the information that’s unique to your app!
In my last post, I gave a high-level overview how to select a threat intelligence vendor and how to integrate indicators of compromise (IOCs) into your SIEM or log management environment. In this post, I will describe in detail how to use the Threat Intelligence plugin that ships with Graylog. I’ll start with the steps necessary to prepare your data, then explain how to activate the feature and how to configure it for use.