Operations | Monitoring | ITSM | DevOps | Cloud

Analytics

timeShift(GrafanaBuzz, 1w) Issue 48

We were in Portland this week attending Monitorama - one of our favorite annual conferences. We got the chance to catch up with old friends, make some new ones, and be part of an amazing community of passionate data and monitoring aficionados. Looking forward to Monitorama AMS in September! Also this week we released Grafana v5.2.0-beta1 and… Elasticsearch alerting has arrived! Download it today and let us know what you think. Check out the specifics on the beta release below.

Instrument Your Ruby App In Minutes with the Honeycomb Beeline for Ruby

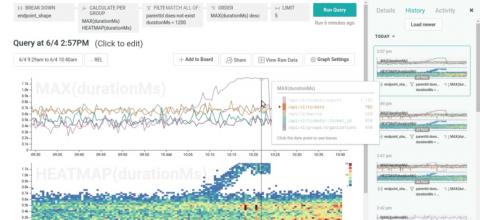
Meet the Honeycomb Beeline for Ruby. Like our Beelines for Go and Node, it understands the common packages you’re using and automatically instruments them to send useful events to Honeycomb. Then once you’ve got a chance to explore your app’s behavior, you can add custom fields specific to your app with just one line of code.

Elasticsearch Performance Tuning

Once you have your Elasticsearch running, you’ll likely eventually find that performance starts to suffer over time. This can be due to a variety of factors, including changes in the way you’re using your cluster to how much and what types of data are being sent in. In order to maintain your cluster, you’ll need to set up monitors to alert you to any warning signs so that you can proactively handle available maintenance windows.