Operations | Monitoring | ITSM | DevOps | Cloud

Dashboards

timeShift(GrafanaBuzz, 1w) Issue 66

All Things Open, a conference focused on open source technologies, was held in Raleigh, NC this week and was bursting at the seams with over 4,500 attendees. Grafana Labs’ own Tom Wilkie gave his RED Method: How to instrument your services talk to a standing-room only crowd. We were excited to speak at and sponsor ATO and look forward to next year.

CloudReady Dashboards Tips & Tricks Part #2

This is the second part of a series on the CloudReady dashboards and visualizations. The first part covered basics like Overviews, Refresh, and Layout settings. In this second part, we’ll cover more advanced creation and usage of dashboards. In part 3 and 4 we’ll cover actual widgets and how they can be used.

timeShift(GrafanaBuzz, 1w) Issue 62

Big news this week - GrafanaCon early bird tickets are now on sale! We’ve released a limited number of early bird tickets, so grab yours before they’re sold out. Also, call for proposals is open until October 15, so don’t wait until the last minute to submit your talk. We’ve gotten some great proposals already, but the more the merrier. Keep an eye out at grafanacon.org for more updates.

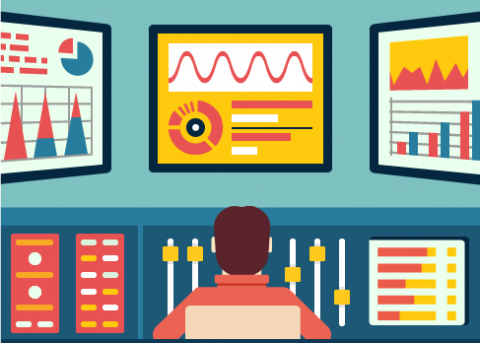
The Role of Dashboards and Portals in IT Performance Monitoring

Managing the end-user experience has become the basis of competition in the digital services world. Most IT organizations today are looking for a portal for managing the performance of digital business services – and a portal is much more than a simple dashboard.