Operations | Monitoring | ITSM | DevOps | Cloud

Memfault

How to get Memfault Device Vitals up and running on an MCU (ESP32) - Integration Walkthrough

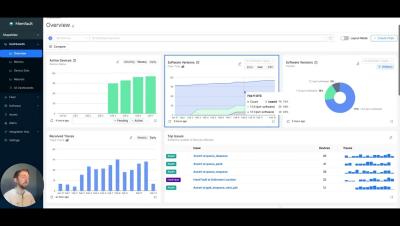
In this video Memfault Field CTO Thomas will walk you through each step to get your MCU based device integrated on Memfault and reporting crash data and our newly released, Device Vitals into Memfault. This walk through is using an ESP32 based device but the same principles can be applied to any MCU and we have lots of guidance available for different chipsets in our technical documentation.

Measure Embedded Device Quality in the Field with Ease

François Baldassari reveals our biggest product release yet. This pivotal launch marks a new era in IoT device performance monitoring, ensuring unparalleled insights into software stability, battery health, and connectivity— the three critical aspects of device vitality. Our latest breakthrough allows for the precise evaluation of your devices' quality, enabling swift identification and resolution of any issues. With François leading the charge, explore how our newest innovation empowers you to.

Beyond the Launch: Enhancing IoT Device Quality

Product quality doesn’t stop when your devices are deployed. In fact, that’s when it matters most. And yet even with rigorous testing, all bets are off once your product hits the field. It’s impossible to anticipate every variable and environment your devices will encounter. So how can you make sure your customers continue to love your product—not only on day 1, but 6 months down the road? Find out exactly how to get the data you need to guide your team’s development decisions and deliver products that perform in the real world.

Diving into JTAG - Debugging (Part 2)

As noted in my previous article Diving into JTAG protocol. Part 1 — Overview, JTAG was initially developed for testing integrated circuits and printed circuit boards. However, its potential for debugging was realized over time, and now JTAG has become the standard protocol for microcontroller debugging. Many Firmware and Embedded engineers first encountered it in this particular context.

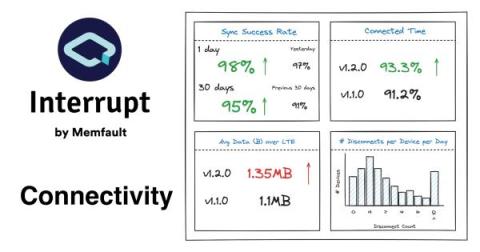
Best Practices for Monitoring Device Connectivity

With the number of wireless SoCs on the market, “Just add connectivity” is finally a reality! “Just” does a lot of lifting in that phrase. Connectivity, whether wired or wireless, adds numerous layers of complexity to your device. Treating your connectivity as a black box early in development is easy, but this strategy will implode when thousands of devices enter the field - trust me, I know. It’s not enough to test from end to end a few times in the office.

Practical Zephyr - Devicetree semantics (Part 4)

Having covered the Devicetree basics in the previous article, we now add semantics to our Devicetree using so-called bindings: For each supported type, we’ll create a corresponding binding and look at the generated output to understand how it can be used with Zephyr’s Devicetree API. Notice that we’ll only look at Zephyr’s basic Devicetree API and won’t analyze specific subsystems such as gpio in detail.

Practical Zephyr - Devicetree basics (Part 3)

In the previous article, we configured software using the kernel configuration tool Kconfig, and we’ve silently assumed that there’s a UART interface on our board that is configurable and used for logging. In this third article of the “Practical Zephyr” series, we’ll see how we configure and use hardware. For this, Zephyr borrows another tool from the Linux kernel: Devicetree.

Practical Zephyr - Kconfig (Part 2)

In this second article of the “Practical Zephyr” series, we’ll explore the kernel configuration system Kconfig by looking at the printk logging option in Zephyr. We won’t explore the logging service as such in detail but instead use it as an excuse to dive deep into Kconfig. Finally, we’ll create our own little application-specific Kconfig configuration. Like Interrupt? Subscribe to get our latest posts straight to your inbox.