Operations | Monitoring | ITSM | DevOps | Cloud

Optimizing Cloud Networks: The Strategic Approach to Eliminating Suboptimal Routing

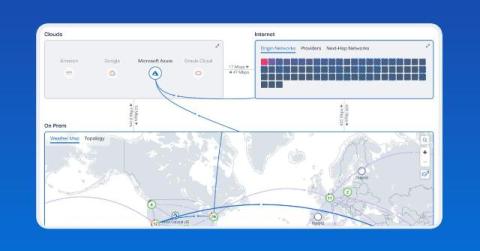
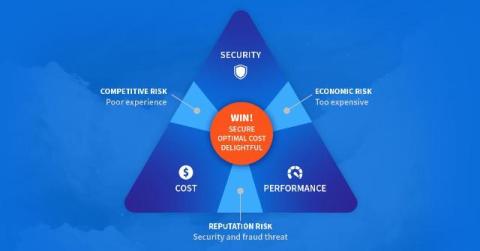
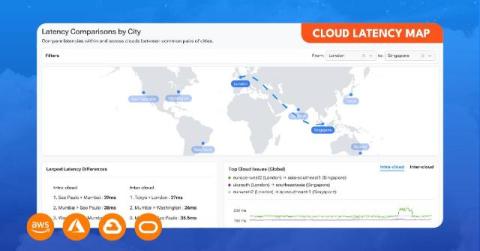
In this post, we look at optimizing cloud network routing to avoid suboptimal paths that increase latency, round-trip times, or costs. To mitigate this, we can adjust routing policies, strategically distributing resources, AWS Direct Connects, and by leveraging observability tools to monitor performance and costs, enabling informed decisions that balance performance with budget.

Understanding Network Traffic Blockages in AWS

In this post, explore the challenges of diagnosing network traffic blockages in AWS due to the complex and dynamic nature of cloud networks. Learn how Kentik addresses these issues by integrating AWS flow data, metrics, and security policies into a single view, allowing engineers to quickly identify the source of blockages enhancing visibility and speeding up the resolution process.

Understanding Transit Gateway Costs

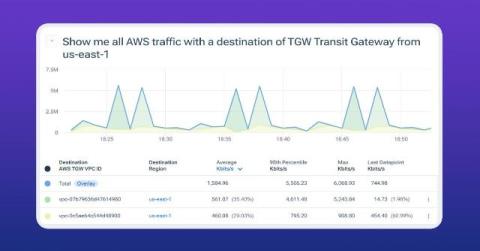
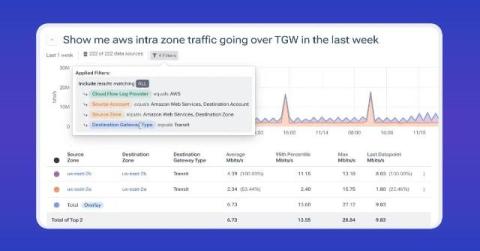
Phil Gervasi shows the importance of understanding traffic over AWS Transit Gateways for cloud cost management. He demonstrates how Kentik provides a visual layout of the entire AWS environment, including Transit Gateways, and allows users to dig into specific details and metrics. Phil also gives a quick look at Data Explorer, where users can observe Transit Gateway traffic over time, create and edit filters, and customize data visualization for sharing and exporting.

What's New at Kentik, Episode 8

Host Leon Adato takes you through the latest updates and features from Kentik. This month, we dive into monitoring analytics for content distribution networks (CDNs), explore the new Use Case Finder in Kentik's knowledgebase, and learn how to include custom fields in Data Explorer. Plus, Leon shares some light-hearted insights on why August is the perfect time to celebrate with Kentik's... uhh... craft brews? Don't forget to like and subscribe to keep up-to-date on everything new at Kentik!

Kentik Bytes - Identifying Idle Cloud Resources

Phil Gervasi introduces a method for identifying idle resources in AWS using the Kentik platform. By selecting dimensions such as Logging Status, Observing VPC ID, and Observing Region, users can filter the data to determine if a resource is actually doing anything from a network perspective. “No Data” messages indicate resources with no network activity, and a more specific filter can be created based on this message to isolate idle resources. By adjusting the time frame and observing bits per second, users can determine how long resources have been idle.