Operations | Monitoring | ITSM | DevOps | Cloud

Datadog

Reduce context switching while troubleshooting with Datadog's IDE plugins

Visibility into the production performance of code iterations helps developers verify that application releases and updates are working as intended. However, when variables such as large-scale user requests and increased server load create issues that were absent during testing, developers will often need to pivot from investigating production data back to their coding environment to address errors and vulnerabilities.

Apache Spark at Scale #datadog #shorts #security #observability

Datadog is an observability and security platform that ingests and processes tens of trillions of data points per day, coming from more than 22,000 customers. Processing that amount of data in a reasonable time stretches the limits of well known data engines like Apache Spark. In addition to scale, Datadog infrastructure is multi-cloud on Kubernetes and the data engineering platform is used by different engineering teams, so having a good set of abstractions to make running Spark jobs easier is critical.

How Complyt is using Datadog APM and distributed tracing to reduce application response times

Learn how Complyt is using Datadog Application Performance Monitoring (APM) and distributed tracing to turn data into knowledge and reduce application response times by more than 80%, which enabled them to meet SLAs for their largest customers.

How Complyt used Datadog's Cloud Cost Management to reduce their cloud spend

Learn how the team at Complyt was able to integrate Cloud Cost Managament in a matter of hours and quickly pinpoint underutilized services to cut their cloud spend in half. CCM delivers cost data where engineers work and with resource-level context like CPU, memory, and requests — easily scoped to their services and applications — so that they can take action and spend effectively.

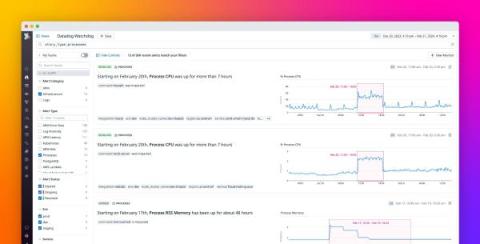
Troubleshoot anomalies in workload performance with Watchdog Insights and Alerts for Live Processes

Processes—the service workloads that run on your infrastructure—are the building blocks of your application, and it’s critical to know how well they operate at every level of the stack. Degraded process performance can lead to downtime for your mission-critical services, resulting in loss of customer trust and potentially impacting revenue for the business.

How to monitor etcd with Datadog

So far in this series, we’ve walked through key etcd metrics and tools you can use to monitor etcd metrics and logs. In this post, we’ll show you how you can monitor etcd with Datadog, including how to: But first, we’ll show you how to set up and configure the Datadog Agent and Cluster Agent to send etcd monitoring data to your Datadog account.

Tools for collecting etcd metrics and logs

In Part 1 of this series, we looked at how etcd works and the role it plays in managing the state of a Kubernetes cluster. We also explored key etcd metrics you should monitor to ensure the health and performance of your etcd cluster. In this post, we’ll show you how you can use tools like Prometheus, Grafana, and etcdctl to collect and visualize etcd metrics. We’ll also show you how to collect etcd logs that provide context for those metrics.

Key metrics for monitoring etcd

Etcd is a distributed key-value data store that provides highly available, durable storage for distributed applications. In Kubernetes, etcd functions as part of the control plane, storing data about the actual and desired state of the resources in a cluster. Kubernetes controllers use etcd’s data to reconcile the cluster’s actual state to its desired state. This series focuses on monitoring etcd in Kubernetes.

Monitor the Windows Registry with Datadog

The Windows Registry is a centralized key-value database that stores permissions, user data, and configuration settings for the Windows operating system and many Windows native applications. The keys stored in the registry provide a granular view into the processes occurring on a Windows host, such as certificate expirations, security checks, and pending reboots.