Operations | Monitoring | ITSM | DevOps | Cloud
Datadog
How Toyota Connected uses Datadog Workflow Automation to reduce time to resolution #datadog #shorts
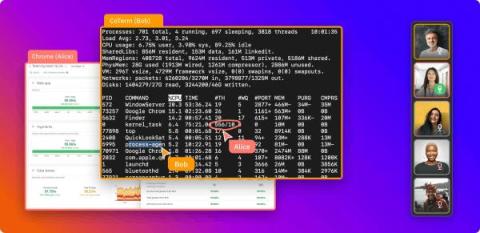
Introducing CoTerm, your collaborative terminal for pair programming and debugging
For too long, engineers have had to piece together an unwieldy combination of tools to collaboratively debug and resolve incidents while pair programming in real time. These activities normally require developers to work individually through a terminal, but the patchwork solutions that allow teams to work together in terminals all have significant drawbacks.
Real User Monitoring by Datadog
Monitor Amazon S3 Express One Zone with Datadog
Amazon Simple Storage Service (S3) now offers a high-performance storage class, S3 Express One Zone, that delivers consistent single-digit millisecond data access for your most latency-sensitive applications. Designed for your most frequently accessed datasets, S3 Express One Zone replicates and stores your data within a single AWS Availability Zone, scales to process millions of requests per minute, and uses hardware and software optimized for low latency.
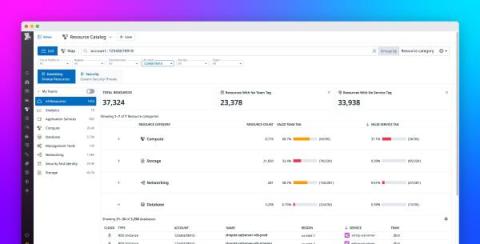
Govern your infrastructure resources with the Datadog Resource Catalog
As an administrator of an expanding, highly distributed infrastructure, you may be responsible for overseeing thousands of on-premise and cloud resources from multiple providers—governed under dozens of accounts by a complex nest of RBAC rules. To query all these resources for purposes such as compliance audits and access management, you may be required to write custom scripts and painstakingly sift through data across disparate tools.
Monitor and improve your CI/CD on AWS CodePipeline with Datadog CI Visibility
CI/CD services such as AWS CodePipeline enable developers to automate and accelerate the process of building, testing, and deploying code. But with the speed, scale, and complexity of the modern software development life cycle, even small performance regressions or increases in failure rates in your CI system can quickly snowball, slowing or even halting releases and causing cost overruns.
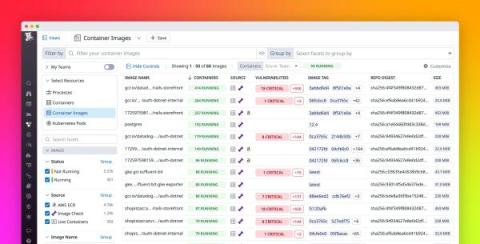
Enhance your troubleshooting workflow with Container Images in Datadog Container Monitoring
Containers are powerful tools for scaling and deploying your applications, but with so many components pulled from different sources, there’s a greater potential for issues within them to go undetected. As a result, you need to monitor every layer of your containerized environments for vulnerabilities and performance problems—from your application to your container images.
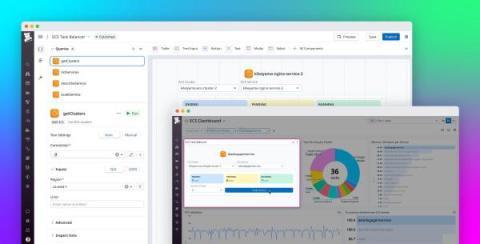
Build custom monitoring and remediation tools with the Datadog App Builder
When you’re responding to an issue with your application in the heat of on-call, you need reliable, well-maintained tooling that’s painless to use. Otherwise, the time you’ll spend combing through monitoring data for context, connecting to hosts and other infrastructure resources, and pivoting between consoles for various managed services can add up quickly and slow your response.
Enhance your visibility into OTel-instrumented apps in AWS Lambda
Enabling auto-instrumentation for your Lambda functions provides detailed insights into the performance and security of your serverless applications. Developers often also use custom instrumentation to fine-tune visibility and further tailor telemetry to their business needs. However, different teams within your organization might use a variety of instrumentation libraries, and achieving more granular visibility can come at the expense of data portability and interoperability.


