Operations | Monitoring | ITSM | DevOps | Cloud

RED Metrics & Monitoring: Using Rate, Errors, and Duration

The RED method is a streamlined approach for monitoring microservices and other request-driven applications, focusing on three critical metrics: Rate, Errors, and Duration. Originating from the principles established by Google's "Four Golden Signals," the RED monitoring framework offers a pragmatic and user-centric perspective on service assurance and service performance.

ISP Monitoring Explained: How to Measure, Manage, and Improve Internet Performance

Reliable internet connectivity isn’t a convenience. It’s mission-critical infrastructure for modern organizations. Every organization today depends on high-speed, reliable internet access for daily operations—from cloud collaboration and data transfer to streaming, remote work, and customer engagement. As digital transformation accelerates, the rise of AI, large language models (LLMs), IoT, and device sprawl has massively increased bandwidth demand and network complexity.

From Idea to Deployment: How To Build a Practical AI Roadmap

AI is being adopted at a faster rate than ever across the business world. According to Stanford, 78% of organizations had implemented AI in some form by 2024. And if that’s not convincing enough, 92% of companies plan to expand their AI investment over the next three years. Practically everyone, including your competitors, is already using AI to gain a competitive edge. If you don’t act soon, there's a real risk of falling behind.

LLM Observability Explained: Prevent Hallucinations, Manage Drift, Control Costs

Large Language Models (LLMs) are transforming how businesses interact with users, automate workflows, and deliver insights in real time. But as powerful as these models are, running them at scale comes with unique challenges, from hallucinations and latency spikes to cost overruns and user trust issues.

How to Push Prometheus Metrics to Splunk Observability Cloud with the OpenTelemetry Collector

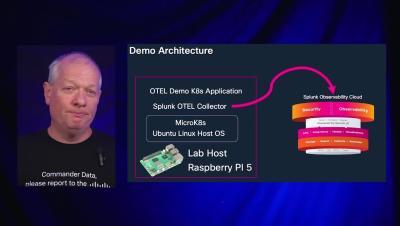
In this video, you’ll learn how to scrape Prometheus endpoints with the OpenTelemetry Collector’s Prometheus receiver and send metrics to Splunk Observability Cloud. We’ll walk through configuring three common data sources (a Python Flask app, node_exporter for host metrics, and the NGINX Prometheus exporter), show how to enrich metrics with resource attributes, and build simple charts in Splunk Observability Cloud. You’ll see how centralized scraping and consistent tagging make it easy to manage and visualize Prometheus metrics in Splunk Observability Cloud.

Monitor Cloud-Native & Hybrid Apps and Business Transactions With Observability Cloud APM

As organizations modernize, most applications don’t fit neatly into one category—they span both traditional three-tier architectures and cloud-native microservices. To monitor these hybrid environments effectively, teams need APM tools that can seamlessly connect the two worlds.

Instrumentation Your Way: Introducing a Combined Splunk AppDynamics Agent

In 2025, microservices are everywhere and Kubernetes is the de facto standard for operating cloud native applications. But not all apps are built in microservices architectures. For most enterprises, hybrid environments are the reality, with their business run on a mix of three-tier and cloud native applications.