Operations | Monitoring | ITSM | DevOps | Cloud

Splunking Netflow with Splunk Stream - Part 2: Basic Netflow Analytics

Hi there, I guess that if you are here, you've already read the first part of this series and want some help to quickly get value from your NetFlow data, building trend analysis and advanced analytics with long term data (i.e months), in addition to playing with real-time data. You can take advantage of Splunk’s super flexible schema on read architecture to exploit your real-time data from the very first moment you get the data in.

Site Reliability Engineer (SRE) Roles and Responsibilities

Software development is getting faster and more complex – frustrating IT operations teams more than ever. So, DevOps gained popularity in order to combat siloed workflows, decreased collaboration and a lack of visibility. While establishing a culture of DevOps has helped teams collaborate better and deliver reliable software faster, DevOps teams don’t necessarily have someone specifically dedicated to developing systems that increase site reliability and performance.

Capitalizing on Cloud to Drive Greater Value from Data and Analytics Insights: A New Accenture Splunk Business Group Business Group

We’ve had a busy week in the Splunk Partnerverse! In addition to the new Splunk Partnerverse Program announced last week, we also shared some significant partnership news with one of our longest-standing partners, Accenture.

Having Trouble Getting the Right Insights From Your Cloud Network Monitoring? Preview Splunk NPM Today!

With cloud computing, containers, virtualization and the move to software-defined infrastructure, your cloud infrastructure monitoring is consistently evolving. New challenges can impact the reliability of business services where network performance is a significant subset. Your network is filled with a multitude of hosts, distributed services, and containers. It’s hard to monitor the health of these ephemeral cloud infrastructure components. How is their behavior affecting your applications?

We're Making Observability Available in Splunk Enterprise!

For you, one or more of these statements (and / or challenges) likely apply to you, and the organization for which you work. Which of these are you hearing or saying? Splunk can help you with these in many ways. Today, I am highlighting one way to address many of these statements, specifically with the Content Pack for Splunk Observability Cloud.

Check System Health on the Go with Splunk Observability Cloud For Mobile

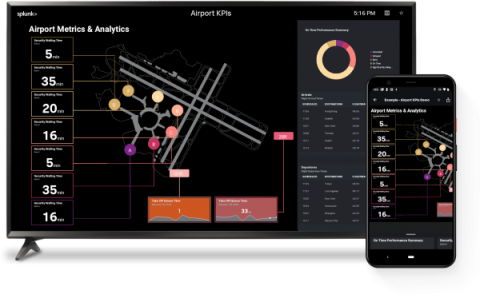
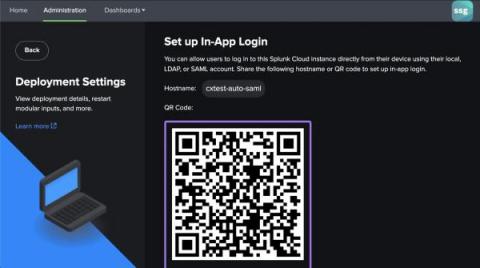
With the demand to meet service level agreements (SLAs), any on-call SRE can tell you that incidents always happen at the wrong time. Things break when you least expect them to (on a date, about to beat a new level in a video game, pizza delivery just arrived, asleep at 3am). During these inopportune moments, you want to make sure it's easy to get the data you need, no matter which device is nearby.

Announcing the General Availability of Splunk Mobile RUM for Native Mobile Apps

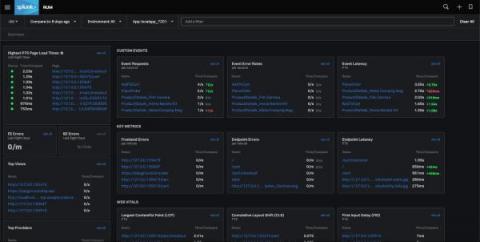
As the world increasingly works, buys, and communicates through native mobile apps. In 2020 there were 218 billion new app installs globally, 13.4 billion from the US alone. The challenge, while iOS and Android applications make up significant portions of user traffic and business, engineering teams and monitoring tools are split between mobile app and backend developers; this creates siloed visibility on how changes to the app or backend components impact each other, and end user experience.

Announcing the Preview of Splunk APM's AlwaysOn Profiling

For application developers and service owners who build and troubleshoot modern enterprise software, resolving production issues requires identifying poor performance across multiple networks, operating systems, servers, configs, and third party dependencies. When the problem is the code itself, code profiling helps identify service bottlenecks by periodically taking CPU snapshots, or call stacks, from a runtime environment.