Operations | Monitoring | ITSM | DevOps | Cloud

Install Netdata on Linux in two minutes

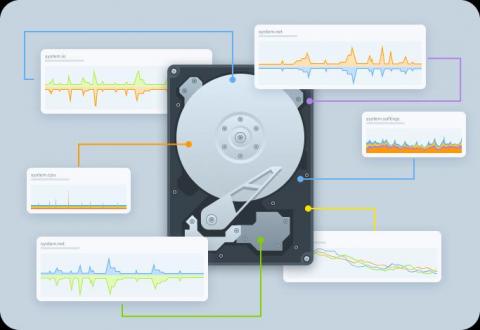
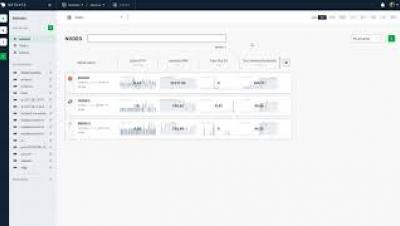
We've tried really hard to make Netdata's open-source monitoring and troubleshooting Agent as simple and hassle-free as possible. This includes installation, which involves a single command, a few minutes of your time, and zero configuration. Once you've installed Netdata, you'll have access to thousands of metrics on hundreds of interactive charts that update every second, with zero configuration required. It'll even auto-detect your favorite services, like an Nginx web server or MySQL database, and collect metrics from those.

Netdata Agent v1.23: Kubernetes monitoring & eBPF observability

Deploying and monitoring performance for an entire Kubernetes cluster can be complex. To simplify the process, we’ve added service discovery functionality to eliminate complex configuration, in addition to more advanced monitoring for viewing activity inside containers. Service discovery identifies k8s pods running on a cluster and immediately starts monitoring system performance. All containers are identified, regardless of complexity.

The role of shift-left testing in an agile environment

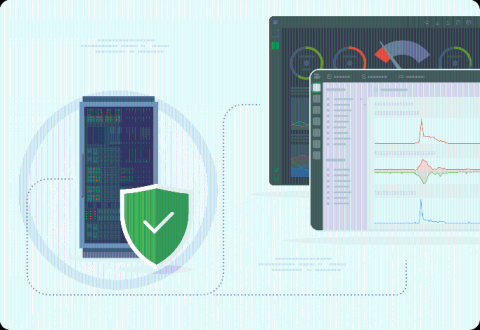
With the rapid growth of security threats to infrastructure, it’s more important than ever to proactively address vulnerabilities. As an open-source project, built on the trust of users and contributors, Netdata has security concerns at its core. Because we’re committed to code security and quality, we apply Agile principles throughout the software development process. A component of this includes regular static analysis.

Release 1.21: Introducing new collectors, faster exporters, and improved security

We’re in the middle of a scary, uncertain time, and we hope those of you reading are staying safe and healthy. Despite the current challenges, the 40+ members of the remote-first Netdata team have been hard at work on the next version of the Netdata Agent: v1.21.0. This release is foundational: While we do have fantastic new collectors and three new ways to export your metrics for long-term storage, many of the most significant changes aren’t even those you’ll notice.

Creating a thriving, agile, remote team

The coronavirus (COVID-19) pandemic has forced many organizations to take unprecedented steps towards remote working. As a fully distributed team, we’ve faced the common challenges of remote work. Based on our experience from our very beginning in 2018, all but a few of these organizations new to remote working will face hurdles to overcome and may try to revert to colocation as soon as possible. Remote working is hard, even when it’s carefully planned and executed.

Contribute to Netdata's machine learning efforts!

Netdata contributors have greatly influenced the growth of our company and are essential to our success. The time and expertise that contributors volunteer are fundamental to our goal of helping you build extraordinary infrastructures. We highly value end-user feedback during product development, which is why we’re looking to involve you in progressing our machine learning (ML) efforts!

Netdata's standard dashboard

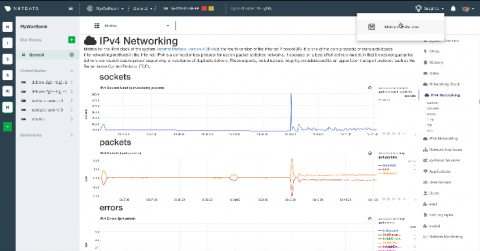
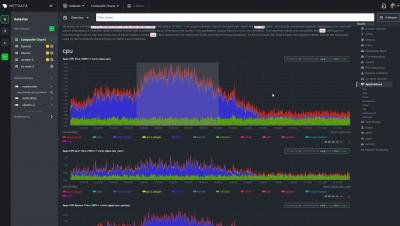
In this video, we’ll take a look at the Netdata's real-time dashboard, which has hundreds of charts, designed by both our team and the community. We’ll cover the elements related to the dashboard, such as contexts, dimensions, menus, and even raised alarms. By default, Netdata listens at port 19999. So, to get to the dashboard, open a web browser and enter your SERVER-IP ADDRESS plus port number or localhost plus port number.

Release 1.20: Kernel monitoring 'superpowers' and infrastructure-wide labels

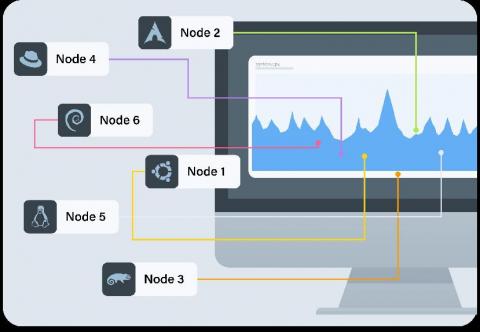
In Netdata’s first major release of 2020, we’re introducing two new features on the opposite ends of the monitoring spectrum. On one hand, we’re releasing an eBPF collector, which lets you collect, monitor, and visualize incredibly precise metrics straight from the Linux kernel. On the other, we added the ability to label agents to help you organize entire infrastructures and see every important piece of information about streaming nodes in one place.

Linux eBPF monitoring with Netdata

Your application isn’t finished when you’ve closed the last if block and you lined up all the brackets. There’s a whole other world of testing, debugging, and optimization that you haven’t even touched yet. To help you more safely step into that complex phase of making your application even better, we’ve just released a brand-new eBPF collector in v1.20 of Netdata.