Operations | Monitoring | ITSM | DevOps | Cloud

logz.io

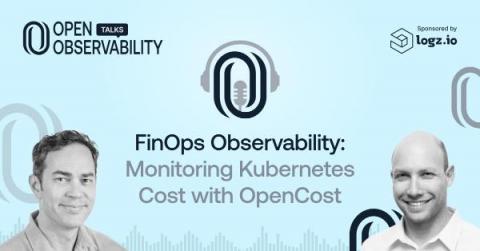
FinOps Observability: Monitoring Kubernetes Cost

With the current financial climate, cost reduction is top of mind for everyone. IT is one of the biggest cost centers in organizations, and understanding what drives those costs is critical. Many simply don’t understand the cost of their Kubernetes workloads, or even have observability into basic units of cost. This is where FinOps comes into play, and organizations are beginning to implement those best practice standards to understand their cost.

Best Practices for MongoDB Monitoring with Prometheus

The MongoDB document-oriented database is one of the most popular database tools available today. Developed as an open-source project, MongoDB is highly scalable and can be set up in your environment in just a few simple steps. When running and managing databases, monitoring is a key requirement.

Beginner's Guide to Prometheus Metrics

Over the past decade, Prometheus has become the most prominent open source monitoring tool in the world, allowing users to quickly and easily collect metrics on their systems and help identify issues in their cloud infrastructure and applications. Prometheus was originally developed by SoundCloud when the company felt their metrics and monitoring solutions weren’t meeting their needs.

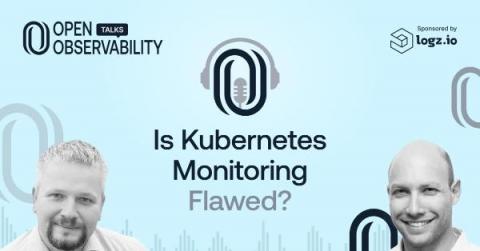
Is Kubernetes Monitoring Flawed?

Kubernetes has come a long way, but the current state of Kubernetes open source monitoring is in need of improvement. This is in part due to the issues related to an unnecessary volume of data related to that monitoring. For example, a 3-node Kubernetes cluster with Prometheus will ship around 40,000 active series by default. Do we really need all that data?

How to Get Full Kubernetes Observability in Minutes

How is your organization handling Kubernetes observability? What tools are you using to monitor Kubernetes? Is it a time-consuming, manual process to collect, store and visualize your logging, metrics and tracing data? And, what are you actually getting out of all that investment? At Logz.io we’re trying to make this process easier for customers who are serious about Kubernetes observability. We’ve made significant investments in this area for Kubernetes use cases.

Reduce MTTR with Logz.io's Single-Pane-of-Glass Observability Data Analytics

Observability data provides the insights engineers need to make sense of increasingly complex cloud environments so they can improve the health, performance, and user experience of their systems. These insights can quickly answer business-critical questions like, “what is causing this latency in my front end?” Or, “why is my checkout service returning errors?” Observability is about accessing the right information at the right time to quickly answer these kinds of questions.

Best Practices for Kubernetes Monitoring with Prometheus

Kubernetes has clearly established itself as one of the most influential technologies in the cloud applications and DevOps space. Its powerful flexibility and scalability have inarguably made it the most popular container orchestration platform in modern software development, helping teams manage hundreds of containers efficiently.

An Introduction to AWS Monitoring with Prometheus and Logz.io

Prometheus is a widely utilized time-series database for monitoring the health and performance of AWS infrastructure. With its ecosystem of data collection, storage, alerting, and analysis capabilities, among others, the open source tool set offers a complete package of monitoring solutions. Prometheus is ideal for scraping metrics from cloud-native services, storing the data for analysis, and monitoring the data with alerts.

Prometheus Roadmap and Latest Updates

We Just celebrated 10 year birthday to Prometheus last month. Prometheus was the second project to join the Cloud Native Computing Foundation after Kubernetes in 2016, and has quickly become the de-facto way to monitor Kubernetes workloads. The plug-and-play experience, just putting Prometheus server and starting to see metrics flowing in tagged with Kubernetes labels, was a compelling offer.

Phantom Metrics: Why Your Monitoring Dashboard May Be Lying to You

Whether you’re a DevOps, SRE, or just a data driven individual, you’re probably addicted to dashboards and metrics. We look at our metrics to see how our system is doing, whether on the infrastructure, the application or the business level. We trust our metrics to show us the status of our system and where it misbehaves. But do our metrics show us what really happened? You’d be surprised how often it’s not the case.