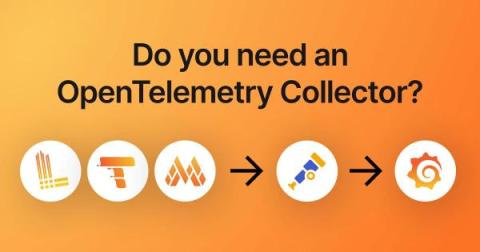
When you use OpenTelemetry SDKs to collect logs, metrics, and traces from infrastructure or an application, you’ll find many references to people using Grafana Agent and OpenTelemetry Collector. They start with an application or infrastructure that sends telemetry, and that data is sent to a collector, which then sends it to a backend like Grafana that may perform many functions, including visualization.
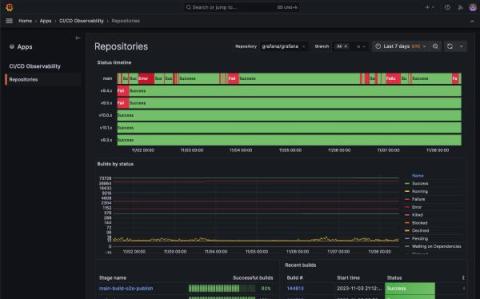
Observability isn’t just about watching for errors or monitoring for basic health signals. Instead, it goes deeper so you can understand the “why” behind the behaviors within your system. CI/CD observability plays a key part in that. It’s about gaining an in-depth view of the entire pipeline of your continuous integration and deployment systems — looking at every code check-in, every test, every build, and every deployment.
ObservabilityCON 2023 took place in London this week, showcasing all the latest and greatest trends in open source observability. Following the opening keynote, the event featured a range of breakout sessions — led by both Grafana Labs experts and members of the Grafana OSS community — that explored observability best practices and lessons learned.